GBP/USD Pulls Back to 1.3325: A Key Support Test for Trend Traders
The British Pound has retreated against the US Dollar this week, with GBP/USD slipping to the 1.3325 area after failing to hold above the 1.3370 resistance zone. This pullback comes amid renewed Dollar strength following mixed economic data from the UK and persistent hawkish rhetoric from the Federal Reserve. With the 50-day moving average sitting at 1.3317 acting as dynamic support and the RSI declining from overbought territory to around 59, the pair is approaching a decision point that trend traders should watch closely.
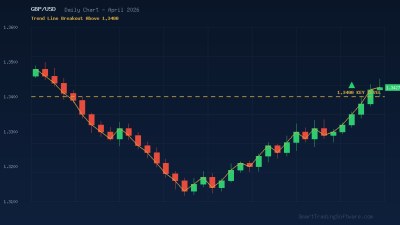
The broader trend remains constructive. GBP/USD has been trading in an ascending channel since early 2026, supported by expectations that the Bank of England will maintain a more cautious approach to rate cuts compared to the Fed. The 52-week moving average at 1.3165 continues to underpin the medium-term bullish structure. However, the current pullback toward the 1.3320–1.3340 support zone could determine whether bulls maintain control or a deeper correction unfolds toward 1.3185.
Trading the Pullback: Support and Resistance Strategy
The current price action offers a textbook pullback-to-support setup. Traders looking to join the intermediate uptrend can use the confluence of the 50-day moving average at 1.3317 and the horizontal support at 1.3340 as a potential entry zone. The declining RSI is approaching the 50 level, which in an uptrend often acts as a momentum reset rather than a reversal signal.
Entry Parameters for Long Positions
A conservative entry would be a bounce confirmation from the 1.3320–1.3340 zone with a bullish candlestick pattern on the H4 or Daily chart. More aggressive traders can place limit orders near 1.3325 with tight risk management. The key invalidation level is a daily close below 1.3185, which would break the ascending channel structure and suggest a trend reversal.
Stop Loss and Take Profit Levels
For swing trades, a stop loss below 1.3280 provides approximately 45 pips of risk. The first profit target sits at the recent swing high of 1.3370, offering a 1:1 risk-reward ratio. The extended target at 1.3450 provides a more attractive 1:2.8 setup, aligned with the upper boundary of the ascending channel. Traders holding for the longer term can look toward the 1.3540 level, which aligns with several analyst forecasts for GBP/USD in Q1 2026.
Why Automated Trading Gives You an Edge on GBP/USD
Currency pairs like GBP/USD trade 24 hours a day, five days a week, making it impossible for manual traders to monitor every support test or breakout opportunity. The pullback to 1.3325 happened during the Asian session when most European traders were asleep. This is exactly where automated trading systems excel — they execute your strategy around the clock without hesitation or emotional bias.
The Support & Resistance Bot is specifically designed for setups like this one. It automatically identifies key support and resistance zones on GBP/USD and executes trades when price tests these levels, with built-in risk management for stop loss and take profit. For traders who prefer trend-following approaches, the Trend Lines Bot can track the ascending channel and enter positions on pullbacks to the trend line, ensuring you never miss a bounce entry even during off-hours.
Key Levels to Watch on GBP/USD This Week
Support Levels
The immediate support cluster sits at 1.3320–1.3340, reinforced by the 50-day moving average at 1.3317. Below that, 1.3280 marks the next significant floor. A break below this area would expose 1.3185, which is the line in the sand for the medium-term bullish outlook. The 52-week moving average at 1.3165 serves as the final backstop before a potential move toward the 1.30 psychological level.
Resistance Levels
Immediate resistance is at 1.3370, followed by the pivot point at 1.3359. A break above 1.3383 opens the path to 1.3450. The major upside targets remain at 1.3540 and ultimately the 1.3615 area, where significant selling pressure is expected based on the multi-month chart structure.
Validating Your Strategy with Backtesting
Before deploying any support-and-resistance strategy on a live account, historical backtesting is essential. The Indicators Tester allows you to test how support and resistance levels performed on GBP/USD across different market conditions and timeframes. You can validate whether the 50-day moving average bounce strategy would have been profitable over the past year and fine-tune your parameters for stop loss width and profit targets before risking real capital.
Getting Started with GBP/USD Automation
1. Analyze the current setup: GBP/USD is testing the 1.3320–1.3340 support zone with declining RSI near 59, within a broader uptrend.
2. Choose your tool: the Support & Resistance Bot for level-based trading or the Trend Lines Bot for channel-following strategies.
3. Backtest your approach using the Indicators Tester on GBP/USD historical data.
4. Deploy on a demo account first to verify execution quality, then transition to live trading with proper position sizing.
Whether the Pound bounces from this support zone or breaks down for a deeper correction, having an automated system in place ensures you capture the move. For questions about which bot suits your GBP/USD strategy best, contact our team for a personalized recommendation.