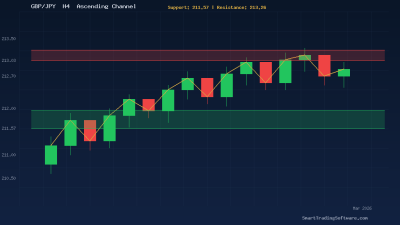
GBP/JPY Climbs Inside an Ascending Channel Near 212.70
The British pound continues to strengthen against the Japanese yen in late March 2026, with GBP/JPY trading around 212.70 inside a well-defined ascending channel on the 4-hour chart. The pair has been climbing steadily from the 207.20 swing low, posting higher highs and higher lows in a textbook bullish structure. The 14-period RSI sits at 66.4 — comfortably in bullish territory without yet reaching overbought conditions — while the ADX reads 60, confirming that the underlying trend carries genuine strength rather than ranging noise.
This kind of orderly trending behavior presents clear opportunities for traders who rely on systematic entry and exit rules. With well-defined support at 211.57–211.96 and resistance between 213.03 and 213.26, the pair offers precise zones where price is likely to react, making it an ideal candidate for automated trend-following approaches.
Trading the Ascending Channel with Moving Averages
The current GBP/JPY setup rewards a trend-continuation strategy built around moving average alignment. When the 20-period exponential moving average (EMA) stays above the 50-period EMA on the H4 chart, the bias remains firmly bullish, and pullbacks toward the lower channel boundary near 211.57 become potential buy zones rather than signals to exit.
Entry Parameters
The optimal entry sits within the 211.57–211.96 support band, where the lower channel boundary converges with recent horizontal support. Traders can look for a bullish candle close above the 20 EMA after a retracement into this zone. The Support & Resistance Indicator automates this identification process, plotting the exact levels where institutional orders cluster so you do not have to draw them manually.
Stop Loss and Take Profit
A stop loss placed 30–40 pips below the support zone — around 211.20 — keeps risk controlled while giving the pair enough breathing room to avoid getting stopped out on normal volatility. For take profit, the first target is the 213.03–13.26 resistance zone, yielding roughly a 1:2.5 risk-to-reward ratio. A more aggressive target sits at 214.98, the recent swing high, which would be triggered by a clean break above 213.26.
Exit and Trail Strategy
Trailing the stop below the 20 EMA on each new H4 candle allows you to ride the trend without giving back large chunks of profit. If price breaks below the 50 EMA on a closing basis, the trend structure shifts and the position should be closed regardless of profit or loss.
Why Automation Matters for GBP/JPY Trend Trades
GBP/JPY is one of the most volatile major crosses, with average daily ranges often exceeding 150 pips. That volatility means opportunities form and expire quickly — a pullback to the channel support may only last a few candles before price resumes its climb. Sitting in front of charts waiting for the entry to appear is not realistic for most traders.
The Trend Lines Bot is designed specifically for this kind of environment. It monitors moving average crossovers and channel boundaries in real time across multiple timeframes, executing entries the moment conditions align. Because the bot follows strict rules without hesitation or second-guessing, it captures setups that manual traders often miss due to delayed execution or emotional interference.
For traders who prefer RSI-based confirmation, the RSI Multi Time Frame Bot adds an additional layer of validation by checking RSI alignment across the H1, H4, and daily charts before triggering a trade. When the daily RSI supports the bullish bias and the H4 RSI pulls back to the 40–50 zone during a retracement, the bot enters with higher confidence than a single-timeframe approach allows.
Key Levels to Watch This Week
The immediate support zone between 211.57 and 211.96 remains the critical area for buyers. A daily close below 211.00 would invalidate the ascending channel and shift the short-term outlook to neutral, suggesting a deeper correction toward the 209.50 area.
On the upside, the 213.03–213.26 resistance band represents the primary barrier. A firm 4-hour close above 213.26 would open the path to the 214.98 high, and beyond that, the 61.8% Fibonacci projection targets 220.90 over the medium term — a level that aligns with the broader uptrend from the 2020 low at 123.94.
The Bank of Japan’s ongoing policy normalization continues to inject uncertainty into yen pairs, so watch for any scheduled BOJ commentary that could trigger sharp moves against the prevailing trend.
Getting Started with Automated GBP/JPY Trading
1. Install your chosen bot on MetaTrader 4 or 5 — the Trend Lines Bot is the most direct fit for this ascending channel setup.
2. Configure the moving average periods (20 EMA and 50 EMA) and set the channel boundaries using the built-in parameter inputs.
3. Backtest the strategy on GBP/JPY H4 data covering at least the last six months using the Indicators Tester to verify performance metrics before deploying with real capital.
4. Set position sizing to risk no more than 1–2% of your account per trade, adjusting lot size according to the 30–40 pip stop loss distance.
5. Monitor performance weekly and adjust parameters if market conditions shift from trending to ranging.
If you need help choosing the right strategy or configuring your setup for GBP/JPY, reach out to our team through the contact page for personalized guidance.