EUR/USD Slides After the Fed's Hawkish Hold — What the Charts Are Saying
The EUR/USD pair is trading at 1.1586 on March 19, 2026, extending a sharp decline that accelerated after the Federal Reserve held interest rates steady at 3.50%–3.75% and Fed Chair Jerome Powell signalled that cuts will not come unless inflation progress resumes. The pair dropped more than 0.8% on the day alone, breaking below several key moving averages on the four-hour chart and putting bears firmly in control of short-term price action.
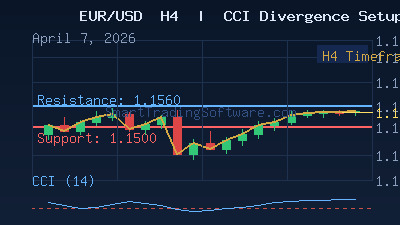
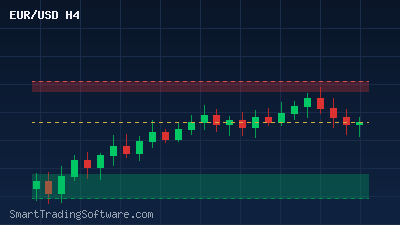
From a technical standpoint, EUR/USD has been retreating from the 1.1821 high printed earlier in March and now sits in the lower half of its Bollinger Band envelope. The 20-period SMA at 1.1495 and the 50-period SMA near 1.1532 are acting as dynamic overhead resistance, while the RSI holds in the low 40s — bearish momentum without yet being oversold, which leaves meaningful room for further downside before any bounce becomes likely.
For systematic traders, this environment offers a clear, rules-based setup: a defined trend, identifiable levels, and a fundamental catalyst that is unlikely to reverse quickly. The remainder of this article breaks down exactly how to approach this trade — and how automation removes the emotional guesswork from execution.
How to Trade the EUR/USD Bearish Setup
The dominant structure on the four-hour chart is a series of lower highs and lower lows, with price capped beneath a descending resistance trend line connecting the 1.1821 swing high. Until that trend line is broken on a closing basis, the path of least resistance remains to the downside. Here is how a systematic trader would structure this trade.
Entry Strategy
The preferred entry is a short position on a pullback toward the 20-period SMA (currently near 1.1495–1.1532). A bearish rejection candle, RSI divergence at that level, or a confirmed break below 1.1480 all serve as valid entry triggers depending on your preferred confirmation style. Aggressive traders may choose to short any break below the 1.1480 support cluster directly, while conservative setups wait for a retest of broken support as new resistance.
An RSI divergence approach works particularly well here. When price attempts to rally and the RSI fails to make a higher high on the four-hour chart, that divergence signals that buying pressure is weakening — exactly the kind of signal the RSI Divergence Bot is engineered to identify and act on automatically, 24 hours a day.
Stop Loss Placement
Stop losses should be placed above the most recent swing high or above the descending trend line, depending on entry timing. For a break-and-retest entry near 1.1480, a stop at 1.1560 (above the 50-SMA and the trend line) offers approximately 80 pips of breathing room while keeping the risk tightly defined. For entries triggered higher near the SMA cluster, a stop above 1.1640 is appropriate.
Profit Targets
The first target is the immediate support zone at 1.1400, which aligns with a prior horizontal floor that has held multiple tests. A deeper secondary target sits at 1.1340. If selling pressure intensifies following any hawkish Fed commentary or disappointing Eurozone data, the longer-term objective extends toward the 1.12–1.13 support region — a zone that corresponds to the SMA200 on the daily chart.
The risk-to-reward on the primary target from a 1.1480 short entry with a 1.1560 stop and 1.1400 target is approximately 1:1. The secondary target at 1.1340 pushes that ratio to 1.75:1, and the extended 1.12 objective produces a ratio exceeding 4:1 — making this one of the more compelling Forex setups available in the current market.
Why Automated Trading Works Best in This Environment
Trend-following setups like the current EUR/USD structure demand precision and consistency that is genuinely difficult for manual traders to maintain across multiple sessions. The London open, the New York crossover, and overnight Asian liquidity all produce micro-pullbacks toward moving average resistance that represent fresh shorting opportunities. A human trader monitoring a screen for 16+ hours will inevitably miss entries or let emotions push stop losses wider after a drawdown.
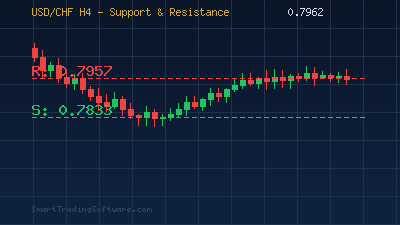
Automated Expert Advisors eliminate that inconsistency. The Support & Resistance Bot is specifically designed to detect high-probability short entries when price retests broken support levels — exactly what is happening at 1.1480 right now. It monitors price action continuously, applies predefined entry and exit rules without hesitation, and executes trades at the exact moment conditions are met, whether the trader is at their desk or asleep.
Pairing execution automation with a proper pre-trade analysis tool such as the Support & Resistance Indicator allows traders to map out the key structure levels before the session opens, then let the bot handle the rest. This division of labour — human strategic oversight, automated tactical execution — is how professional systematic traders approach trending Forex pairs.
Key Levels to Watch This Week
Understanding the price map on EUR/USD this week is essential before sizing any position. Here are the levels that matter:
Resistance zones (where shorts can be initiated or added): 1.1495 (20-period SMA on H4), 1.1532 (50-period SMA on H4), 1.1617 (100-period SMA), 1.1724 (200-period SMA), and the descending trend line from 1.1821 — currently intersecting near 1.1650.
Support zones (profit-taking levels and areas to tighten stops): 1.1480 (immediate structure), 1.1400 (prior horizontal floor, primary target), 1.1340 (secondary structure), 1.1250 (intermediate), and the 1.12–1.13 band (major long-term demand zone).
The most important single level to watch is 1.1400. A sustained daily close below this zone would be a significant technical signal confirming the medium-term downtrend and opening the door to the 1.12 region. Conversely, a surprise hawkish pivot from the ECB or a series of weak US economic releases could push the pair back above 1.16 and invalidate the bearish thesis — which is why defined stop losses are non-negotiable.
Getting Started with EUR/USD Automated Trading
Setting up a systematic EUR/USD short strategy using SmartTradingSoftware tools takes less time than most traders expect. Here is the process step by step:
- Map the structure. Install the Support & Resistance Indicator on your MetaTrader 4 or MetaTrader 5 chart. Set it to the H4 timeframe and let it auto-plot the zones identified in this analysis. You will immediately see the 1.1480 and 1.1400 levels highlighted.
- Select your Expert Advisor. For this trend-following setup, the RSI Divergence Bot or the Support & Resistance Bot are both well-suited. Configure the lot size to align with your account risk tolerance — typically 1–2% of equity per trade.
- Define your parameters. Set the entry trigger (pullback to SMA or break of 1.1480), stop loss (above 1.1560), and take-profit levels (1.1400 primary, 1.1340 secondary). Enable trailing stop functionality if you wish to let winners run toward the 1.12 target.
- Back-test the configuration. Use the MetaTrader Strategy Tester with at least 12 months of H4 historical data to validate the settings before deploying live capital. Adjust lot size and stop distance based on the historical drawdown metrics.
- Go live with controlled risk. Deploy the EA on a demo account for one full week to confirm it behaves as expected across different session types, then move to a live account with a conservative position size.
Questions about configuration, broker compatibility, or which Expert Advisor best matches your trading style? The SmartTradingSoftware team is available through the contact page and typically responds within one business day. Let automation handle the execution while you focus on the strategic view.