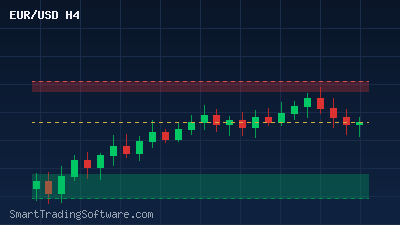
EUR/USD Holds at 1.1560 as Markets Eye 1.1648 Resistance
The EUR/USD pair is trading at 1.1560 on March 26, 2026, consolidating just below a pivotal resistance zone that has defined price action for the past two weeks. After bouncing from the 1.1400–1.1450 support corridor earlier this month, the euro has climbed steadily inside a bullish ascending channel — but momentum indicators suggest the rally could be running out of steam right as sellers prepare to defend the 1.1626–1.1648 ceiling.
The 14-day Relative Strength Index sits at 41.4, a reading that shows buyers have not yet reclaimed control of the short-term trend. Meanwhile, the 50-day moving average at 1.1586 is acting as dynamic resistance overhead. For traders who rely on confluence between price structure and oscillator signals, this setup offers a clearly defined risk-reward scenario on both the breakout and the rejection side of the trade.
Trading the Resistance Test: Breakout versus Rejection
Two scenarios dominate the near-term EUR/USD outlook, and both can be traded systematically with the right tools.
Bullish Breakout Above 1.1648
A sustained close above 1.1648 — ideally on above-average volume — would confirm the bullish channel and open a measured move toward 1.1745, which aligns with the upper boundary of the weekly channel drawn from the January low. Traders looking for this setup should wait for a four-hour candle to close above 1.1650 before entering long, placing a stop-loss below the breakout candle low near 1.1590. That gives a risk of roughly 60 pips against a reward target of about 95 pips at 1.1745, a comfortable 1:1.6 ratio.
RSI confirmation adds weight to the signal: if the indicator crosses back above 50 at the same time price clears resistance, it signals a genuine shift in momentum rather than a liquidity sweep. The RSI Divergence Bot can monitor these multi-condition setups around the clock, entering the trade the moment both price and oscillator criteria align — something that is difficult to execute manually during overnight sessions.
Bearish Rejection at Resistance
If the pair stalls between 1.1626 and 1.1648 and prints a bearish engulfing or pin-bar pattern, the odds tilt toward a retracement back to the 1.1450 support shelf. The fact that the MACD histogram is printing at -0.001 — barely negative but not yet bullish — supports the argument that upside fuel is limited without a catalyst.
Short entries on confirmation of the rejection pattern, with a stop-loss above 1.1665 and a target at 1.1455, yield a risk-reward ratio near 1:2.5. The Support & Resistance Indicator can automatically plot these zones on your chart so you are ready to act the moment the pattern completes.
Why Automated Execution Matters at Key Levels
Resistance tests like the one unfolding at 1.1648 are notorious for producing false breaks and rapid reversals. The speed at which price can spike above a level, trigger stop-losses, and then reverse means that manual traders often end up on the wrong side of the move. Automated strategies eliminate emotional hesitation and execute pre-defined rules in milliseconds.
For trend-following setups on EUR/USD, the Trend Lines Bot uses a combination of moving-average crossovers and slope detection to enter in the direction of the prevailing channel. During periods when price oscillates between support and resistance — exactly the environment we see now — the bot can switch between breakout mode and mean-reversion mode based on volatility filters you configure in advance.
Before deploying any strategy with real capital, however, backtesting on historical data that includes similar consolidation-to-breakout phases is essential. The Indicators Tester lets you run your RSI and moving-average parameters against years of tick data so you can verify win rates and drawdown expectations before committing funds.
Key Levels to Watch This Week
Resistance sits at 1.1626 (the lower edge of the supply zone), 1.1648 (the zone ceiling where sellers have rejected price twice), and 1.1745 (the first major target above the breakout). On the support side, 1.1570 is the intraday pivot, 1.1450 marks the bottom of the ascending channel, and a clean break below 1.1400 would invalidate the bullish structure and expose 1.1300.
Economic data this week adds a layer of fundamental risk. Friday's Core PCE release from the United States could shift Fed rate-cut expectations, and any surprise in the eurozone's preliminary CPI print on Thursday may force the ECB to revise its guidance. Both events have the potential to catalyze the directional break that technical traders are positioning for.
Getting Started
1. Open your MetaTrader 4 or MetaTrader 5 platform and load the EUR/USD H4 chart.
2. Mark the 1.1626–1.1648 resistance zone and the 1.1400–1.1450 support zone on your chart, or install the Support & Resistance Indicator to have them drawn automatically.
3. Attach the RSI Divergence Bot with your preferred RSI period and divergence sensitivity settings. Set the bot to trade only when price is within 30 pips of a key level.
4. Run a backtest using the Indicators Tester on the last 12 months of EUR/USD H4 data to validate your parameter choices.
5. Switch to a demo account first, monitor performance for at least 20 trades, and then scale into live execution once the results match your backtest expectations.
If you have questions about configuring any of these tools for the current EUR/USD setup, our team is available to help — visit our contact page to get in touch.