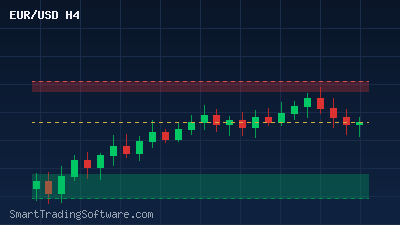
EUR/USD at 1.1540: CCI Divergence Signals a Potential Turning Point
The EUR/USD pair opened the week of April 7, 2026, at 1.1543, trading within a tight intraday range of 1.1535 to 1.1548. With average daily volatility sitting at just 79 pips over the last five sessions, the pair is coiling beneath a cluster of resistance levels that could define the next directional move. The broader macro backdrop is unusually complex: the US dollar faces structural headwinds from escalating trade tariff tensions, yet geopolitical risk continues to provide intermittent safe-haven support for the greenback. For technical traders, however, the setup is becoming clearer — the Commodity Channel Index (CCI) has entered oversold territory and is printing a bullish divergence on the daily chart, a signal that often precedes meaningful corrective rallies in currency pairs.
Understanding how to capitalise on such signals — especially in a choppy, headline-driven market — requires both precision and automation. In this article, we break down the current EUR/USD technical picture, explain the CCI divergence setup, and show how traders can use algorithmic tools to execute this strategy with discipline.
Reading the CCI Divergence on EUR/USD
The Commodity Channel Index was originally designed for commodity markets, but it has become a staple tool among forex traders for identifying cyclical turns. When price makes a new low while the CCI forms a higher low, that divergence indicates weakening bearish momentum — and historically, it has provided reliable entry signals for counter-trend moves.
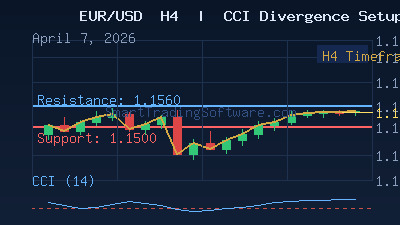
On the EUR/USD daily chart, this pattern is currently forming. The pair posted its recent swing low around the 1.1420–1.1435 zone (the lower Bollinger Band on the D1 timeframe), while the CCI registered a diverging higher low in deeply oversold territory (below -250). The 14-day RSI stands at 42.89 — neutral, but still with room to recover toward the 55–60 range before encountering overbought conditions. This combination of CCI divergence and RSI positioning creates a favourable asymmetric setup for long positions.
Entry Parameters
The ideal entry zone for a CCI-divergence long is on a confirmed close above the 1.1500 psychological level, which currently acts as the primary pivot. A daily close above 1.1500 shifts the balance from bearish consolidation to potential bullish reversal. Aggressive traders may enter on the divergence signal alone (current price around 1.1535–1.1548), while conservative traders should wait for a break and retest of 1.1530 as support.
Stop-Loss Placement
Stops should be placed below the recent structural low at 1.1420, giving the trade approximately 115–120 pips of risk from current prices. This sits just below the D1 lower Bollinger Band, which provides an additional layer of technical confirmation for the invalidation level. Sizing positions to risk no more than 1–2% of capital per trade at this stop level is strongly advisable.
Take-Profit Targets
The first target is the immediate resistance cluster at 1.1560 (the D1 EMA20 area), which also aligns with a previous swing high. A successful break of 1.1560 would open the path toward 1.1630, the upper boundary of the current triangle pattern. The more ambitious target — contingent on a broader dollar reversal driven by tariff policy shifts — is the 38.2% Fibonacci retracement at 1.1666, and then the 50% level at 1.1745. Partial profit-taking at each level helps lock in gains while keeping exposure to the full move.
Why Automation Makes This Strategy More Effective
Manual execution of CCI divergence strategies carries a common pitfall: traders either enter too early (before confirmation) or miss the move entirely while waiting for the "perfect" setup. Emotional reactions to short-term price swings — especially in a news-driven environment like the current dollar-tariff situation — lead to premature exits and suboptimal results.
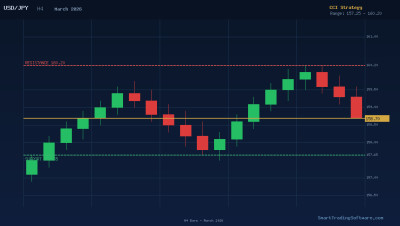
Algorithmic trading bots eliminate this inconsistency. The CCI Strategy Bot by SmartTradingSoftware is purpose-built to scan for CCI overbought and oversold conditions across multiple timeframes, execute entries on divergence confirmation, and manage stops and targets automatically. Unlike manual traders who second-guess every spike, the bot applies the same logic on every candle close — without hesitation and without emotion.
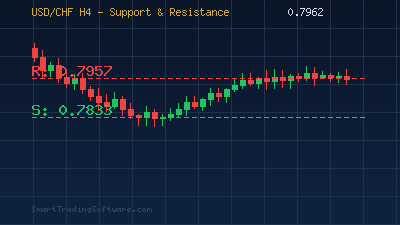
Complementing the CCI approach, the Support & Resistance Bot adds a layer of structural confirmation by identifying key S/R levels (like the 1.1500 and 1.1560 zones mentioned above) and only allowing entries when price interacts with those levels in alignment with the CCI signal. This confluence-based filtering significantly improves the signal-to-noise ratio in choppy market conditions.
For traders who want to validate these strategies before committing real capital, the Indicators Tester allows backtesting of CCI-based setups on historical EUR/USD data. With real tick data and adjustable parameters, you can measure the historical win rate of CCI divergence entries at the 1.1500 zone across multiple market cycles — a critical step before any live deployment.
Key Levels to Watch on EUR/USD This Week
Given the current price action and the macro context, here are the levels that matter most for EUR/USD in the week of April 7–11, 2026:
Resistance levels: 1.1548 (today's high / intraday ceiling), 1.1560 (D1 EMA20 and previous swing high), 1.1630 (triangle upper boundary and medium-term trend shift threshold), 1.1666 (38.2% Fibonacci), 1.1745 (50% Fibonacci).
Support levels: 1.1500 (major psychological round number — the primary pivot), 1.1475 (minor structural support), 1.1420–1.1435 (D1 lower Bollinger Band — the bearish invalidation zone for bulls), 1.1353 (deeper extension if 1.1420 fails).
The 1.1500 level is the single most important price to monitor. A daily close above 1.1500, accompanied by CCI recovering from oversold territory, would be the clearest signal that the corrective rally is underway. Conversely, a daily close below 1.1420 would negate the bullish divergence and shift the outlook back to bearish, targeting the 1.12–1.13 range that analysts have flagged as the next major structural support.
Dollar fundamentals add an interesting dimension. Markets are now pricing a 64% probability that the Federal Reserve holds rates through December 2026 — a dramatic shift from earlier in the year when two rate cuts were the consensus expectation. Meanwhile, the ECB's posture remains relatively stable. If tariff negotiations produce any dollar-negative surprises in the coming days, EUR/USD could react sharply to the upside, making the current CCI divergence setup even more compelling for bulls.
Getting Started with the CCI Strategy on EUR/USD
If you're ready to trade the EUR/USD CCI divergence setup with an automated edge, here is a practical path forward:
- Identify the divergence: Confirm on your daily EUR/USD chart that the CCI has formed a higher low while price made a lower low — the current setup as of April 7, 2026.
- Set your entry trigger: Use a limit order at 1.1500–1.1510, or wait for a confirmed daily close above 1.1530 as a breakout entry.
- Define your risk parameters: Stop below 1.1420 (approximately 115 pips), targeting 1.1560 (R:R ~0.4:1), 1.1630 (R:R ~0.9:1), and 1.1666–1.1745 for extended moves.
- Deploy automation: Install the CCI Strategy Bot on your MetaTrader 4/5 platform and configure it to the D1 or H4 timeframe with the parameters above.
- Backtest before going live: Use the Indicators Tester to validate this exact setup on at least 12 months of EUR/USD historical data before committing real capital.
Market conditions change quickly — especially in an environment driven by trade policy headlines and geopolitical uncertainty. The traders who consistently outperform are those who combine disciplined technical setups with automated execution. If you want to discuss how to customise a CCI-based strategy for your specific trading style, contact our team for a personalised consultation.