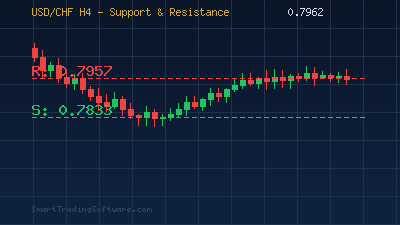
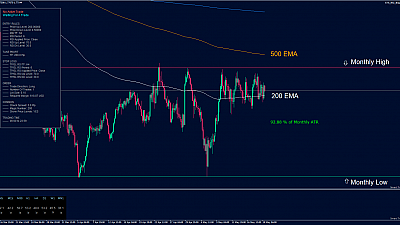
USD/CHF at 0.7962: Trading the Oversold Bounce with Support and Resistance The USD/CHF pair is trading near 0.7962 as the last week of March 2026 begins, rebounding from the 0.7833 support zone that held firm during mid-month selling pressure. With the 14-period RSI dipping to 28.91 on the daily chart — well into oversold t ...
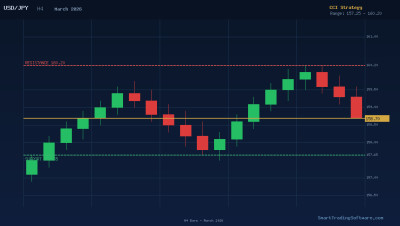
USD/JPY at 158.70: Trading BOJ-Fed Divergence with CCI Strategy
USD/JPY at 158.70: BOJ-Fed Divergence Sets Up a Classic CCI Trade The USD/JPY pair is trading around 158.70 as of late March 2026, having oscillated within a tight 157.05–159.75 range throughout the month. Behind this consolidation lies a fascinating macro story: the Bank of Japan continues its cautious tightening c ...
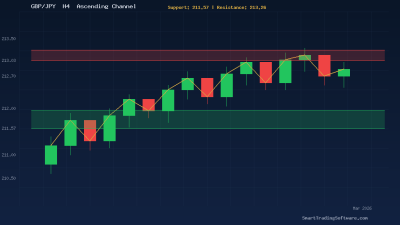
GBP/JPY Ascending Channel at 212.70: Riding the Trend with Moving Averages
GBP/JPY Climbs Inside an Ascending Channel Near 212.70 The British pound continues to strengthen against the Japanese yen in late March 2026, with GBP/JPY trading around 212.70 inside a well-defined ascending channel on the 4-hour chart. The pair has been climbing steadily from the 207.20 swing low, posting higher highs ...
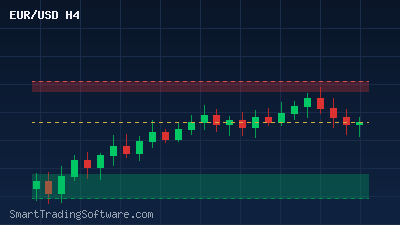
EUR/USD at 1.1560: Trading the Resistance Test with RSI Signals
EUR/USD Holds at 1.1560 as Markets Eye 1.1648 Resistance The EUR/USD pair is trading at 1.1560 on March 26, 2026, consolidating just below a pivotal resistance zone that has defined price action for the past two weeks. After bouncing from the 1.1400–1.1450 support corridor earlier this month, the euro has climbed steadily i ...
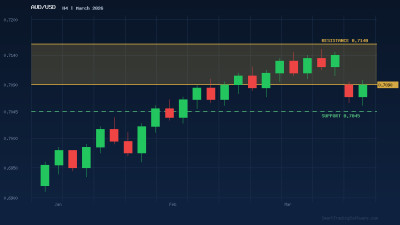
AUD/USD at 0.7140 Resistance: Trading the Breakout with RSI Confirmation
AUD/USD Tests 0.7140 Resistance After RBA Rate Hold The Australian dollar has staged an impressive recovery in March 2026, climbing from its early-month dip near 0.6950 to challenge a key resistance cluster around 0.7090–0.7140. This move follows the Reserve Bank of Australia’s decision to hold its cash rate at 4.1%, whi ...
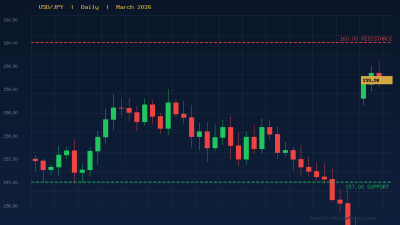
USD/JPY at 160.00 Resistance: Trading the Breakout or Rejection
USD/JPY Tests the 160.00 Ceiling: A Critical Moment for Yen Traders The USD/JPY pair has climbed to 159.20 as of late March 2026, pressing once again against the formidable 160.00 psychological resistance level that has capped price action repeatedly since early 2024. With the pair trading above its 50-day and 100-day ...
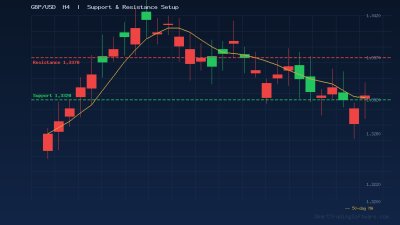
GBP/USD Pullback to 1.3325: Trading the Trend Bounce in March 2026
GBP/USD Pulls Back to 1.3325: A Key Support Test for Trend Traders The British Pound has retreated against the US Dollar this week, with GBP/USD slipping to the 1.3325 area after failing to hold above the 1.3370 resistance zone. This pullback comes amid renewed Dollar strength following mixed economic data from the UK ...
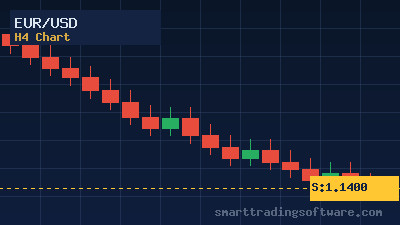
EUR/USD Bearish Setup: Trading the Fed's Hawkish Hold in March 2026
EUR/USD Slides After the Fed's Hawkish Hold — What the Charts Are Saying The EUR/USD pair is trading at 1.1586 on March 19, 2026, extending a sharp decline that accelerated after the Federal Reserve held interest rates steady at 3.50%–3.75% and Fed Chair Jerome Powell signalled that cuts will not come unless inf ...

Gold Hits $5,000: How to Trade XAU/USD with Automated Strategies in 2026
Gold Breaks the $5,000 Barrier: What It Means for Traders In March 2026, gold (XAU/USD) crossed the historic $5,000 per ounce mark for the first time ever. This milestone, driven by geopolitical uncertainty, central bank buying, and inflation hedging, has created exceptional trading opportunities for both long-term investors ...
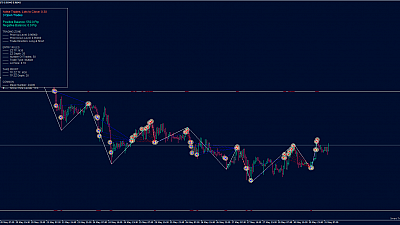
USD/CHF trading in range with STS Zig Zag Bot
As we wrote in our Analysis from 23.05.2022, we expected the price to move in the Range by the end of the Month. We loaded our STS_Zig_Zag_Bot to open short and long positions in 20-period Zig Zag and close them in reverse 20-period Zig Zag. The Bot opened a total of 45 trades - 25 short ...
EUR/USD long positions closed with STS Zig Zag Bot
As we wrote in our Analysis , we expected the price to continue moving upwards, so we loaded our STS_Zig_Zag_Bot to open long positions on each H1 candle with a descending 20-period Zig Zag and to close all positions on an ascending 20-period Zig Zag on H1 Timeframe. Our Bot opened 7 long ...
GBP/AUD long position with STS RSI Breakout Bot
As we wrote in our Analysis from 19.05.2022, we expected the currency pair GBP/AUD to break out from the formed range, so we loaded our STS_RSI_Breakout_Bot to open a Long position when the STS_RSI_MTF_Indicator shows a value of 70 or more. STS_RSI_MTF_Indicator reached 70 and our ...
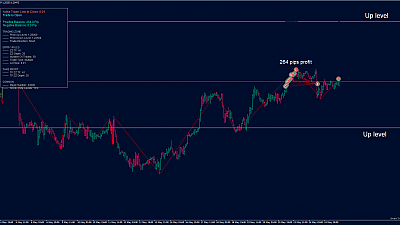
GBP/USD trading in range with STS Zig Zag Bot
As we wrote in our Analysis from 23.05.2022, we expected the currency pair GBP/USD to be in Range with Up level 1.28 and Down level 1.235. That's why we loaded two STS_Zig_Zag_Bots . The first Bot was set to open Short positions on each H1 candle in which there was an ascending 20-period ...
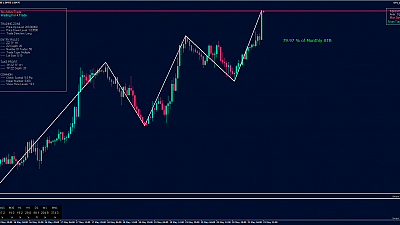
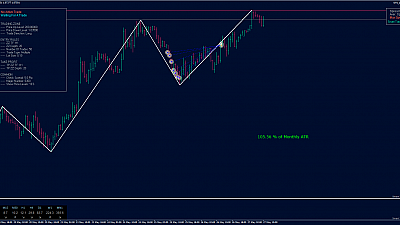
EUR/USD waiting for long positions with STS Zig Zag Bot
The EUR/USD currency pair formed a bottom in the middle of the Мonth at 1.0350. Since then we are in a strong upward movement and our STS_ATR_Distance_Indicator shows that the price has passed 83.6% of its Мonthly ATR (Average Monthly Movement for the last 6 months). We expect the price to continue t ...
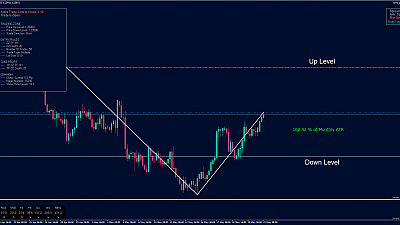
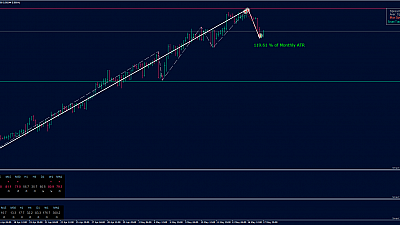
GBP/USD waiting for range with STS Zig Zag Bot
The GBP/USD currency pair formed a bottom in the middle of the Month at 1.2155. Since then we are in a strong upward movement which, at the current levels, is about 85% of the Monthly ATR. Our STS_ATR_Distance_Indicator shows that in the downward movement the price has passed 102% of its Monthly ...
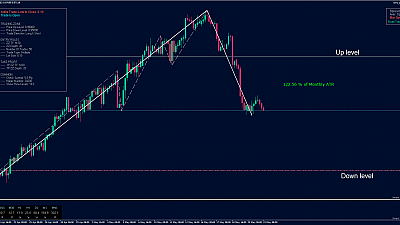
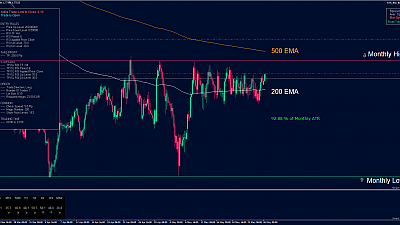
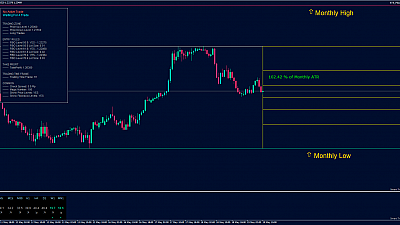
USD/CHF waiting for range with STS Zig Zag Bot
The currency pair USD/CHF made a strong upward movement in the beginning of the month and during last week - a strong downward movement, which formed a V-shaped peak at the psychological level of 1.00. Our STS_ATR_Distance_Indicator shows that since the beginning of the Month the price has passed 122% of its Monthly ...
GBP/AUD long position with STS RSI Breakout Bot
The currency pair GBP/AUD formed a Bottom for the current Month at 1.71792. Our STS_ATR_Distance_Indicator shows that since the beginning of the Month we have passed 92% of the Monthly ATR (Average Monthly Movement for the last 6 months). STS_RSI_MTF_Indicator shows range values between 70 and 30 on all Tim ...
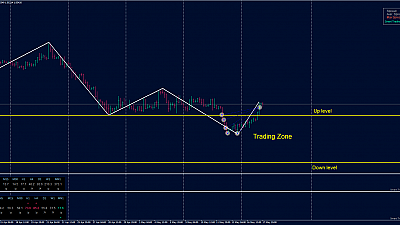
GBP/USD waiting for long positions with STS Fibonacci Bot
The currency pair GBP/USD forms a Monthly Low at 1.2155 and our STS_ATR_Distance_Indicator shows that since the beginning of the Month we have passed 102% of the Monthly ATR (Average Monthly Movement for the last 6 months). Our STS_RSI_MTF_Indicator shows oversold conditions on the Weekly and Monthly charts with ...
EUR/USD long positions closed with STS Zig Zag Bot
As we wrote in our Аnalysis from 13.05.2022, we expected the price to fall down to the trading zone between 1.05 and 1.018. We loaded our STS_Zig_Zag_Bot to open long positions in the defined trading zone, on each H4 candle in which we have a descending 12-period Zig Zag and close all positions on an ascending 20-period ...
USD/CHF short positions closed with STS Zig Zag Bot
As we wrote in our Analysis from 16.05.2022, the currency pair USD/CHF was at a strong Resistance and our STS_ATR_Distance_Indicator showed that since the beginning of the Month the price has passed 118% of its Monthly ATR (Average Monthly Movement for the last 6 Months). We were expecting a downward movement ...