The fundamental analysis is a method for analyzing and evaluating different types of assets. Fundamental analysis aims to calculate its fair price and compare it to the current market price. This kind of analysis is most suited for evaluating stocks , although it is very useful for other types of financial ...
Economic Calendar
The economic calendar gives information about the scheduled data releases and events related to the financial markets. They can affect the prices, so fundamentalists always keep a watchful eye on the calendar. Traders use the data to plan future trades or protect open ones. The economic calendars are available ...
Interest Rate
The interest rate is the amount of interest due per period, as a proportion of the amount lent, deposited or borrowed. In general, the interest rate is the price charged by central banks for lending money to the private banks. It is a major factor that affects the fundamentals of the currency pairs. The interest ...
Gross Domestic Product (GDP)
The Gross Domestic Product (GDP) is a summary of the overall economic activity of a country. GDP represents the total value of all goods and services produced in an economy for a given period. It is published annually, but there are also monthly and quarterly publications. It can be calculated using different ...
Inflation
Inflation shows the rate of increase in the prices of the goods and services in an economy over a period of time. When prices increase, purchasing power (currency value) decreases. A certain amount of money then buys less than it used to. Deflation is the opposite of inflation (a negative inflation). ...
Labor Market
The labor market refers to the supply of and the demand for labor, where employees provide the supply and employers – the demand. The labor market is a key factor for the well-being of the economy. A high employment rate means stable income for the citizens, high living standard, sustainable purchasing ...
Retail Sales
The Retail Sales measure the value of the goods and services purchased during a period of time. The calculation of this indicator is done by sampling information collected from companies that sell goods and services to end consumers. The indicator covers anything from small shops to multinational companies and is ...
Technical Analysis
Technical analysis is a way of analyzing the markets. It does that by examining the price and the volume using historical data. Technical analysts believe that all fundamental factors that could influence the price of a certain asset are already reflected in that price and that in order to predict future moves, ...
Trading Styles
There are different trading styles and every trader should choose the one that suites his way of life, personality and goals. It is better to study the differences and make an informed decision, instead of switching from one style to another. Why are you trading? How much time can you devote to this? How much risk are ...
Types of Charts
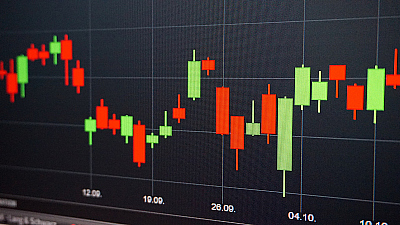
There are different ways to plot the price action on a chart. Although different charts present the same thing, they visualize it in a different way. They can provide a whole lot of price characteristics, or just a clean look. It is also a matter of personal preferences, as so much things on the chart are ...
Technical Analysis Terms
Looking at the chart we see the price moves up and down, forming all sort of patterns along its path. Technical analysis is about monitoring those seemingly random moves and identifying their cause and outcome. The trader must learn to look deeper into the chart and read the data that it contains. There ...
Support and Resistance Levels
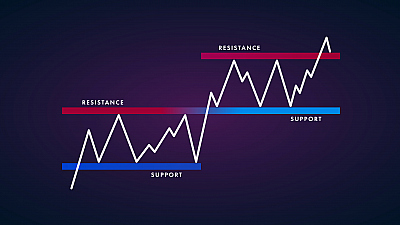
Support and resistance are levels that seem to limit the price from going further. The support level is where the price stops falling and bounces back up. The resistance level is where the price stops rising and heads down. Sometimes the price breaks the support or resistance line just by little ...
Technical Indicators
Technical indicators are mathematical calculations, based on price or volume, that are used to evaluate the short-term state of the market and to indicate its possible development. There are indicators that use the same chart scale as the price and are plotted together with the price action. They give a different perspective ...
Candlesticks Patterns
Candlesticks patterns are certain arrangements of candles that can indicate a change in the trend . Both the bodies and the shadows are meaningful for the pattern. They mark the reversal of the trend or a period of uncertainty and are accordingly called reversal patterns and continuation patterns. ...
Chart Patterns
The chart pattern is a visual formation or shape within the price chart that gives clues to the expected direction of the next market move and its target levels. Chart pattern are significant only when there is a clear trend. You cannot change the direction of something that has no direction. The ...
Psychology of Trading
Trading psychology refers to the emotional and mental state of traders, something that can at times drive the markets. It represents various aspects of the traders’ character that influence their performance. Although each and every person in the markets is a different individual, there are some basic emotions that ...
