Looking at the chart we see the price moves up and down, forming all sort of patterns along its path. Technical analysis is about monitoring those seemingly random moves and identifying their cause and outcome.
The trader must learn to look deeper into the chart and read the data that it contains.
There is plenty of information in the price action and technical analysis provides the tools to extract and synthesize it.
To learn how to read the chart we must start with the basics. The most general terms that technical analysis uses are things like swing highs and swing lows, trend, trendline, channel and range.
SWING HIGH & SWING LOW
As the price moves across the chart up or down, there are points that form tops (the highest point around) and bottoms (the lowest point around). They mark a level where the price changes directions.
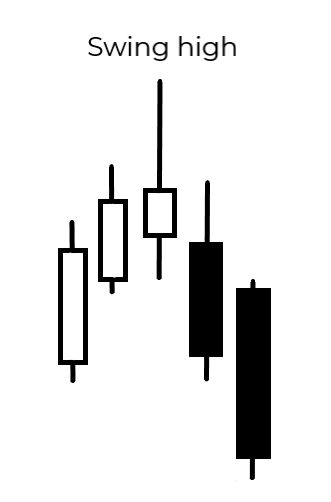
The swing high is the highest price level where the bulls bought before the bears took control of the game and brought the price down. It is marked by the highest point of the highest candle and, to be considered a swing high, it needs to have at least two candles on each side that have lower highs.
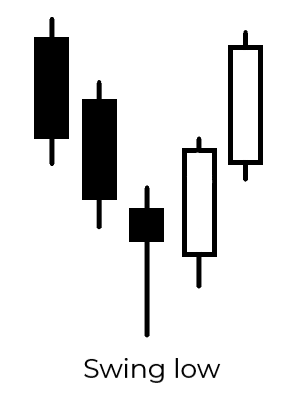
The swing low is the lowest price level where the bears sold before the bulls came into play and turned the price up. It is marked by the lowest point of the lowest candle and needs to have at least two candles on each side that have higher lows, in order to be considered a swing low.
TREND AND TRENDLINE
The trend is simply the direction of the current price move. The price can move upwards, downwards or horizontally around the same level.
The trendline is a line that we draw to identify the price direction. It can connect swing highs or swing lows to show us whether the price is going up or down.
UPTREND
The uptrend means an overall increase of the price. Of course, we cannot expect that the price will move in a straight line upwards. There are fluctuations within the trend, called corrections or pullbacks, but the general direction should keep its path up.
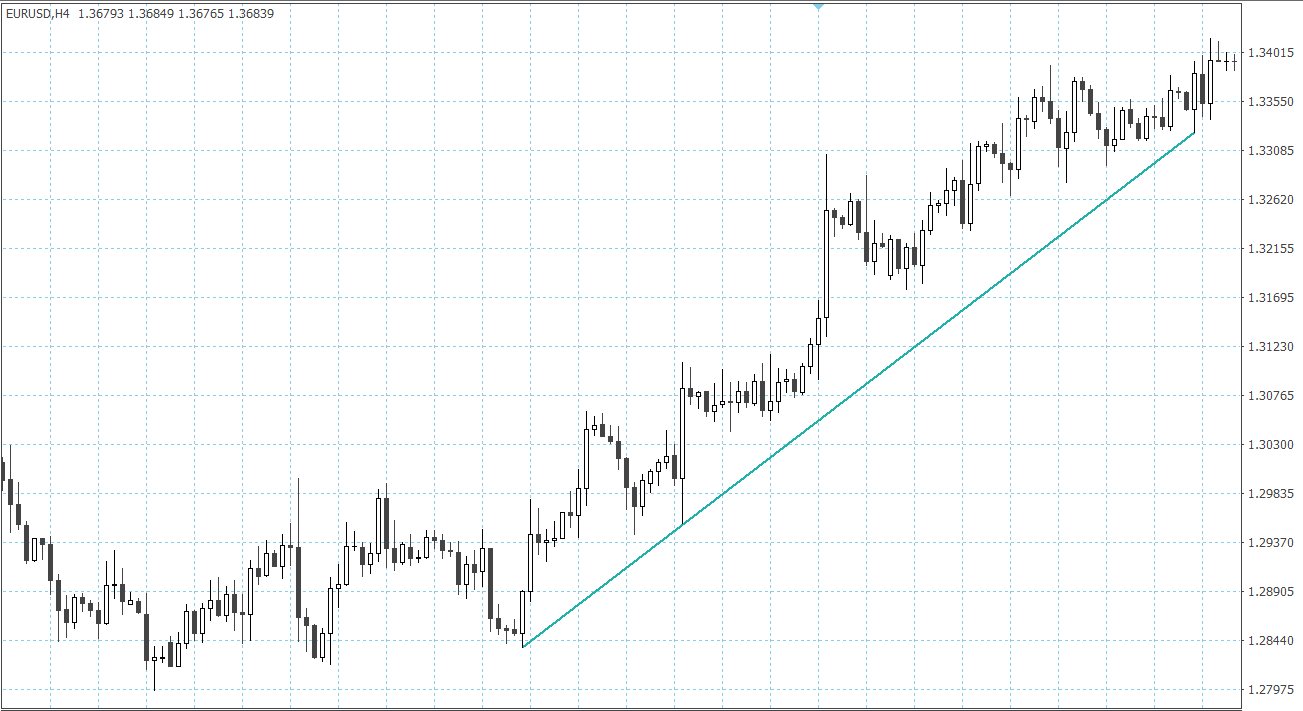
The uptrend is marked by higher swing lows and a general rise of the price. We recognize it by drawing a trendline that connects at least two or three swing lows.
While the trend is up, traders assume it will continue to rise, until there are indications of weakening or breaking of the trend.
DOWNTREND
The downtrend is an overall decrease of the price. It is marked by consecutive lower swing highs and a general move downwards. We can draw a trendline connecting at least two or three swing highs to get a clearer picture of the downtrend.
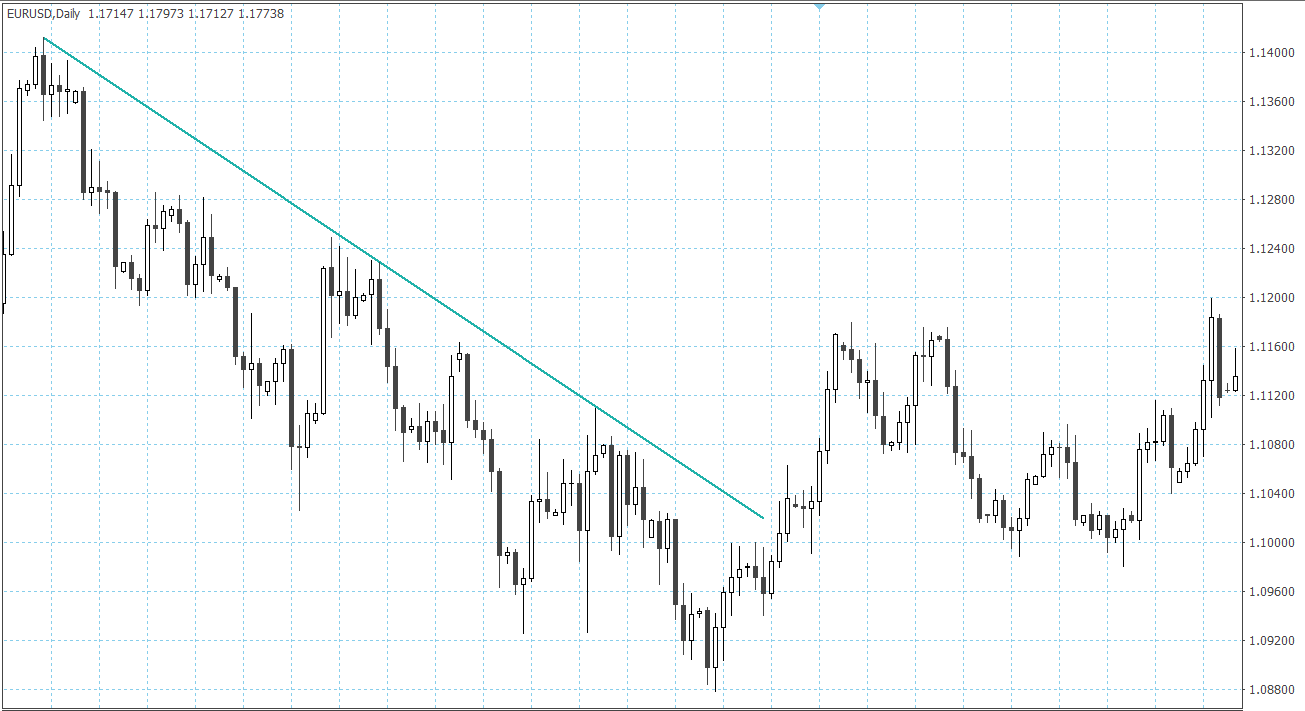
The downtrend is assumed to continue until there are indications that it may be weakening or breaking.
CONSOLIDATION
The consolidation is a period without a clear trend. Prices are moving up and down but stay around the same levels. This is called ranging. The consecutive swing highs are of similar heights and the consecutive swing lows have similar lows.
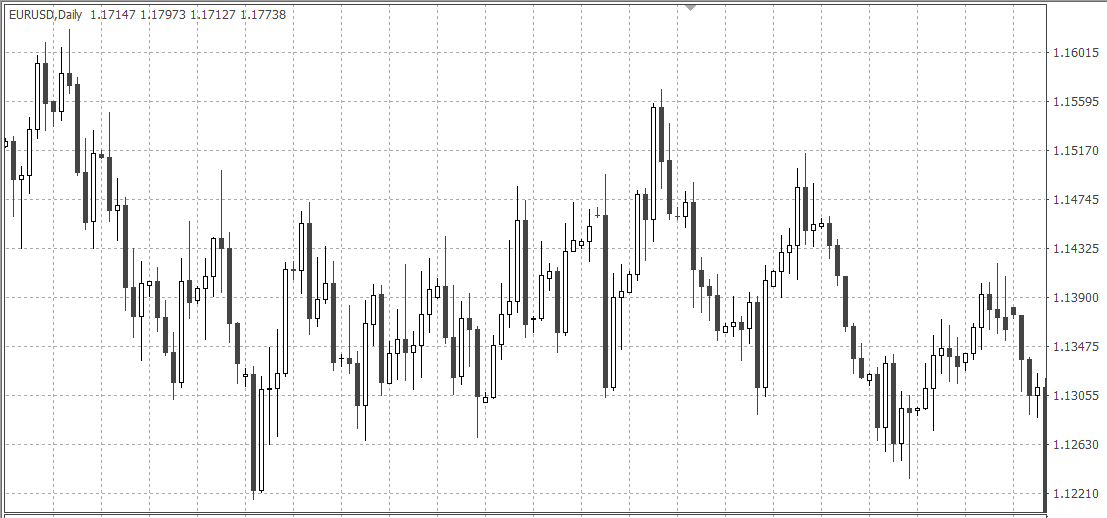
You can determine the current trend by using different methods. The daily and the weekly charts are commonly used for picking the trend, though it all depends on the trading style. A scalper, for example, would look for a trend on the hourly or even the 30-minute chart, while a day trader would monitor the weekly or daily chart.
PRICE CHANNEL
The price channel is the overall range of movement of the price. It is defined by drawing two parallel lines, one connecting the swing highs of the period, and one connecting the swing lows.
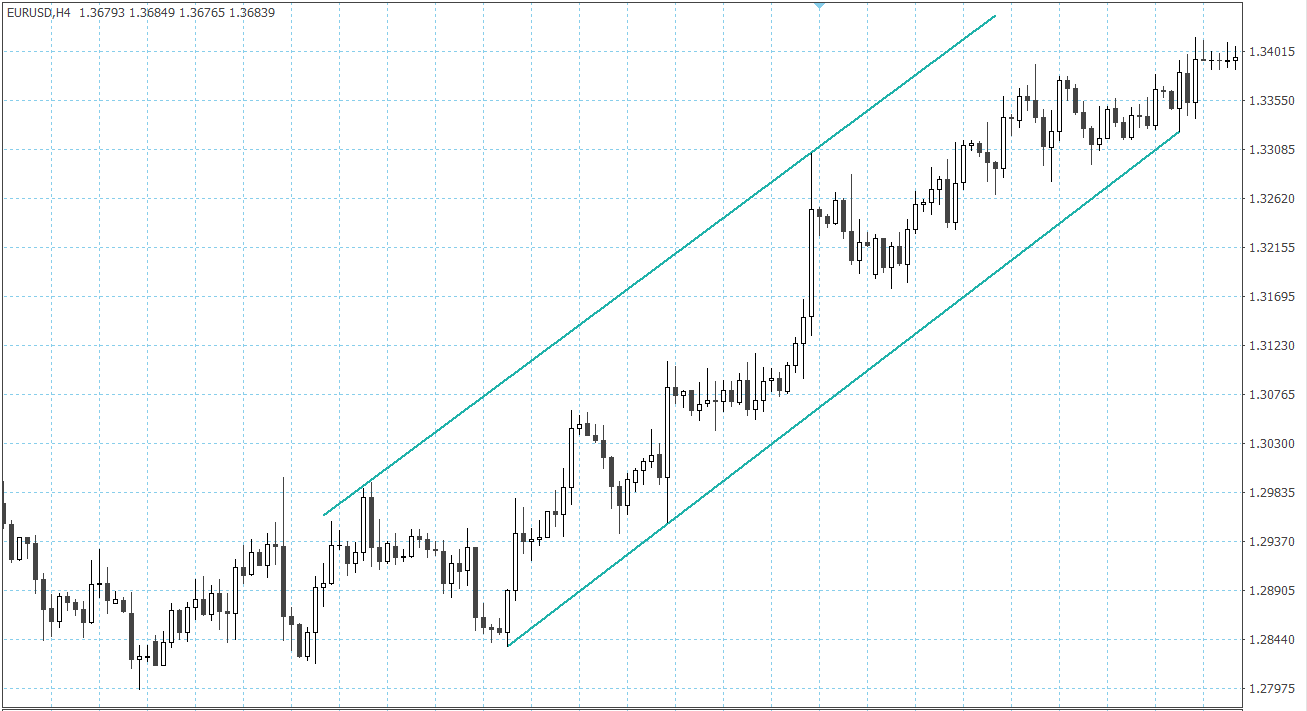
It is a very useful technical tool for confirming whether the ongoing trend is still strong (then the price would oscillate between the channel boundaries) and for identifying breakouts (points where the price breaks outside the price channel).
It would be great if the price moved in a way that all swing highs and lows aligned perfectly for the trader to draw the trendline through them and then to have a clean parallel price channel. But in the real world, things just aren’t that perfect. So, to some extent, it is up to the trader to decide the exact position of a trendline or a price channel.


