The Retail Sales measure the value of the goods and services purchased during a period of time.
The calculation of this indicator is done by sampling information collected from companies that sell goods and services to end consumers. The indicator covers anything from small shops to multinational companies and is of great importance for the GDP calculation, as it makes up about 70% of the total U.S. economic output.
The US agency in charge of this report is the Census Bureau. The Retail Sales report is released monthly and contains data on the total sales for the previous month, the percentage change, and the change in year-over-year sales.
Inflation is not adjusted for and the results are quite volatile.
Seasonal price changes, or the holiday shopping season can alter the data, so figures could be misleading at times.
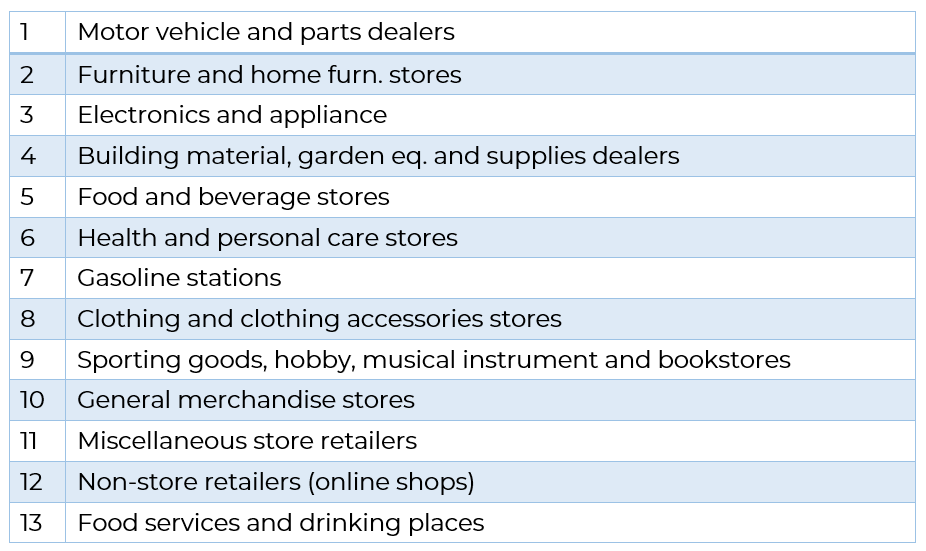
The Census Bureau divides the retail sales into 13 categories.

The auto and gas sectors tend to fluctuate more than the other sales. Moreover, consumers don’t actually have a choice, when it comes to fuel prices. Those are the reasons why the report is presented in two ways: with those two sectors, and without them.
The second gives a clearer picture of the consumer sentiment for the period.
Healthy retail sales figures typically mean positive movements in equity markets.
They are good news for the shareholders of retail companies, as that means higher earnings. Because of the tight connection between retail sales and GDP, if the monthly figures through the year are strong, then it's likely that the GDP report will be solid as well.


