The chart pattern is a visual formation or shape within the price chart that gives clues to the expected direction of the next market move and its target levels.
Chart pattern are significant only when there is a clear trend.
You cannot change the direction of something that has no direction.
The time it takes for a pattern to form is important.
The longer it takes and the larger the price movement within the pattern, the greater the potential of the subsequent price move.
There are two basic types of chart patterns – reversal and continuation. The first type indicates that we can expect a change in the direction of the current price trend. The second shows that the market is just pausing before the prevailing trend continues. The formation of a continuation pattern takes much less time than the formation of a reversal pattern.
REVERSAL CHART PATTERNS
Reversal patterns signify that the bulls (in an uptrend) or the bears (in a downtrend) are getting exhausted. The pattern itself is the time when the two team are more or less equally active and then, when the pattern is fully developed, the other team (possibly) takes control and leads the price to bearish/bullish territory.
There are many patterns, but we will examine the most significant of them all.
HEAD AND SHOULDERS / INVERSE HEAD AND SHOULDERS
The Head and Shoulders pattern is a reversal pattern. There are two versions, depending on the price trend. If the current trend is up, the pattern is called Head and Shoulders, and if the current trend is down, it is Inverse Head and Shoulders.
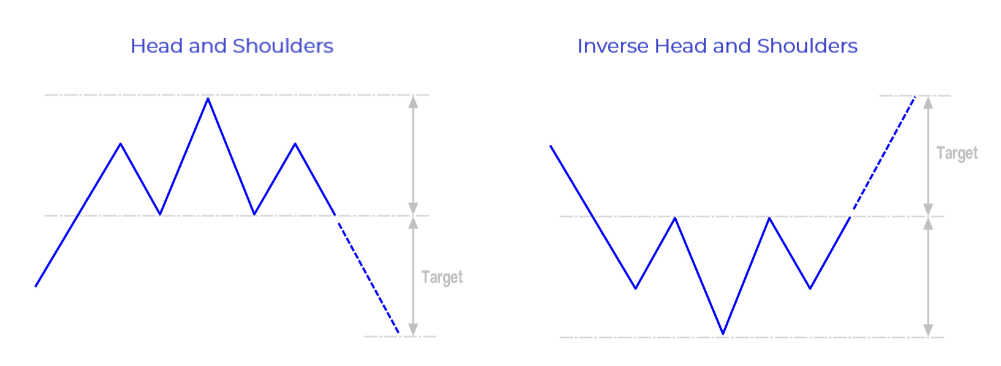
They develop exactly the same way, so we’ll just take a look at the first of them.
The Head and Shoulders pattern consists of three peaks, of which the middle one is the highest (this is the head) and the other two are lower and similar in heights (the shoulders).
This pattern forms after a long rise, when the bulls begin to lose steam. The price makes a high, but sellers appear and turn the price down (forming the left shoulder). Bulls take the price up to a new extreme but bears once again take control (forming the head). Bulls return to the market one last time, but sellers are determined and strong and lead the price down, forming the right shoulder. Once the level connecting the two formed lows (the so-called neckline) is breached, the pattern is confirmed.
This is one of the most reliable reversal patterns. Its significance may be reinforced by some additional factors.
The trading volume plays an important role in the formation of the Head and Shoulders pattern. It should increase during the formation of the left shoulder and decrease during the formation of the head and the right shoulder. Before the break below the support, the volume should increase sharply.
It is also worth observing whether the steepness of the ascent declines. If the left side of the first shoulder is steeper than that of the head, and the left side of the head is steeper than that of the second shoulder, it means that the bulls are getting weaker.
All this shows that the power of the buyers is decreasing, and that the sellers are taking control and that the reversal is the most probable outcome.
The Head and Shoulders pattern works the same way in a downtrend. When it signifies the transit from bearish to bullish market, the pattern is called Inverse Head and Shoulders.
DOUBLE TOP / DOUBLE BOTTOM
The Double Top and Double Bottom are reversal patterns. Double Top develops in an uptrend and Double Bottom – in a downtrend.
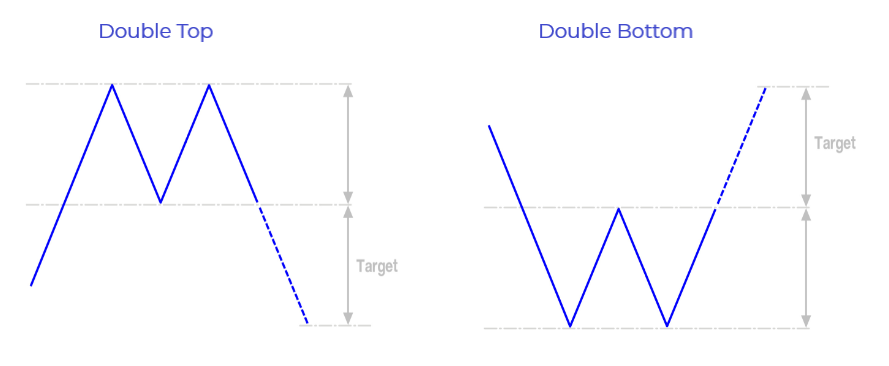
As they form exactly the same way, we will just examine the Double Top pattern.
The pattern comprises of two highs and one low between them. The two peaks are of similar height and the pullback between them is moderate. The level where the pullback stops dropping is called Neckline.
The second top is the same or even lower than the first top. This shows that the bulls were not strong enough to reach higher than the first top. The pattern is completed when the price, after it has formed the second top, breaches the neckline.
A good indicator that the pattern is strong is the volume. If the volume decreases during the formation of the second top, this is good indication that the price might change directions.
RISING WEDGE / FALLING WEDGE
The Wedge is a reversal pattern formed by drawing two trendlines, one connecting the highs and one – the lows, forming a kind of a funnel. The Rising Wedge develops in an uptrend and the trendlines that shape the pattern are usually ascending. The lower trendline, that connects the lows is steeper than the one connecting the highs.
The Falling Wedge develops in a downtrend and is exactly opposite to the Rising Wedge.
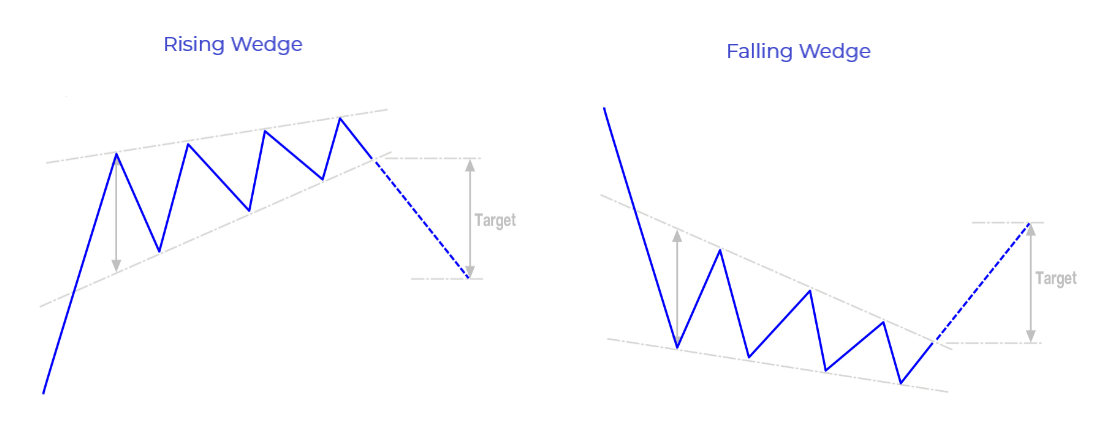
The Rising Wedge has to have at least three highs. It is sometimes falsely considered a continuation pattern. As each new high is higher than the previous it looks like the trend is still going strong.
But the selling after each peak and the strong resistance line that forms show that buyers are having difficulties going further up. The narrowing of the funnel formed by the two trendlines indicates that the strength of the bulls is weakening. Bull pressure begins to fade, and a breakout of the support line confirms the pattern. A strong move downwards could be expected afterwards.
The volume is most likely to fall during the formation of the Wedge.
CONTINUATION CHART PATTERNS
These are patterns that indicate the continuation of the preceding trend. They are often referred to as Consolidation patterns because they develop during the time the market takes a short break while the two teams are testing each other. After the pattern forms, the trend resumes.
There are many continuation patterns, but we’ll just take a look at the most common.
FALLING WEDGE / RISING WEDGE
These are pretty much the same formations as the Rising and Falling Wedges that indicate a reversal. Just a few features mean the difference between reversal and continuation.
The Wedge pattern signals a continuation of the trend when the Falling Wedge develops in an uptrend and the Rising Wedge develops in a downtrend.
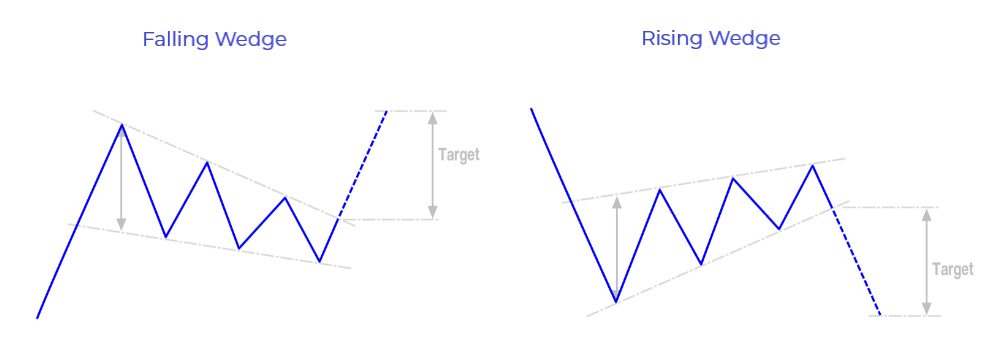
The Falling Wedge consists of two descending trendlines, one connecting the tops and one connecting the bottoms of the pattern. The upper trendline (the resistance) is steeper than the lower (the support). Each consecutive high within the pattern is lower than the previous.
This indicates that although there are sellers to take the price down, they are not strong enough. This is evident from the fact that the support line is not as steep as the resistance line, meaning the bears are failing in bringing the price further down. After the short pause, the bulls break the resistance line and push the price upwards.
RECTANGLE
The bullish and bearish Rectangles are continuation formations confined between two horizontal trendlines. There should be at least two or three highs and lows that form the resistance and support lines. The two patterns develop in identical manner.
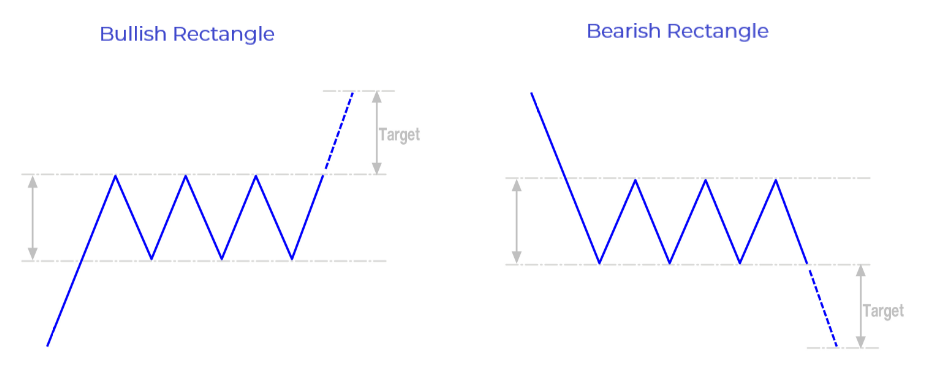
The current trend is up when a resistance level stops the price and it bounces back. A period of consolidation follows, where the price touches the same support and resistance line several times. This means the battle is on between bulls and bears.
The volume typically falls as the pattern advances. When the price breaches the resistance level the pattern is confirmed, and the trend continues its direction.
PENNANT
The Pennants are another example of the patterns that indicate continuation of the price. The bullish Pennant develops in an uptrend, while the bearish Pennant – in a downtrend.
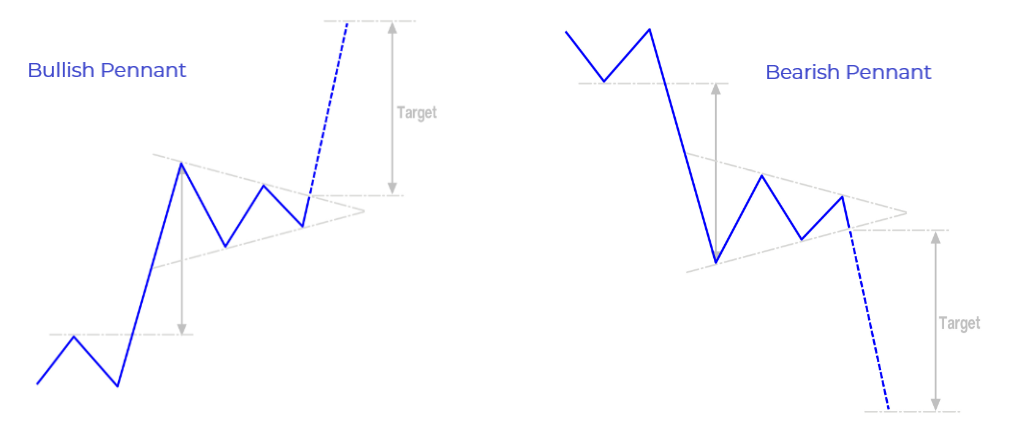
The bullish Pennant starts with a sharp rise of the price. This is often referred to as the first flagpole of the pattern. Then follows a period of consolidation, where the price oscillates in a narrowing range (like a small triangle). This is the pennant. When the price breaks the upper trendline of the pennant, it shoots up to form the second flagpole.
The volume during the development of the pattern is very important. It should be high during the formation of the first flagpole, then it should decrease with the pennant and when the price breaches the resistance line, the volume should rise again.
