Candlesticks patterns are certain arrangements of candles that can indicate a change in the trend.
Both the bodies and the shadows are meaningful for the pattern.
They mark the reversal of the trend or a period of uncertainty and are accordingly called reversal patterns and continuation patterns.
There are many patterns. We can generally separate them into bullish and bearish patterns. Bullish patterns indicate that the price is likely to rise, while bearish patterns indicate that the price is likely to fall.
No pattern works all the time.
They show tendencies in the price movement and they do not guarantee anything.
REVERSAL CANDLESTICKS PATTERNS
These are patterns that show the probable reversal of the trend. There should be a clear trend, so that the formation is considered valid.
They form when the team that has led the way so far begins to lose strenght. The battle between the bulls and the bears continues for a few periods (candles) and then, usually, the pretender team prevails and takes the price in the opposite direction.
These are some of the most common reversal candlesticks patterns.
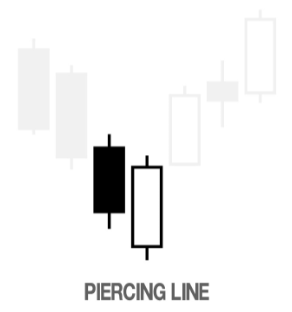
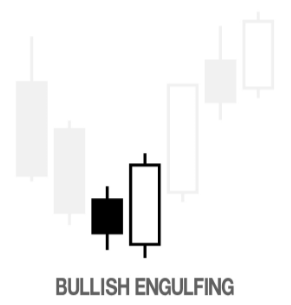
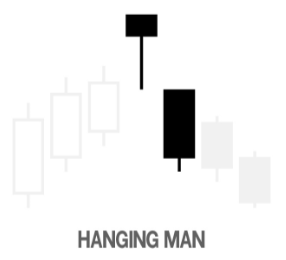
BULLISH ENGULFING PATTERN
This reversal pattern forms when a candlestick with a white body completely covers (engulfs) the black candlestick of the previous period.
The market should have a clear downtrend before the pattern forms. Shadows of the previous candlestick may not be covered.
The Bullish Engulfing pattern indicates that the buyers outnumber the sellers and a reversal in the trend is possible.
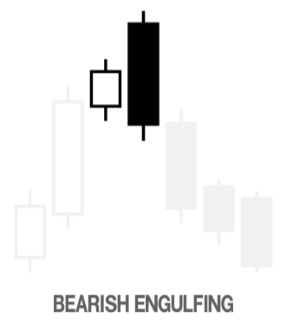
BEARISH ENGULFING PATTERN
This reversal pattern forms when a candlestick with a black body completely covers (engulfs) the white candlestick of the previous period.
The market should have a clear uptrend before the pattern forms. Shadows of the previous candlestick may not be covered.
A Bearish Engulfing pattern forms when the sellers outnumber the buyers. It indicates that sellers are now in control and that the price could start to decline.
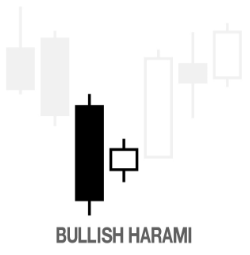
BULLISH HARAMI
The Bullish Harami is a reversal pattern and consists of a candlestick with a big black body followed by a candlestick with a small white body, completely covered by the first. The direction of the trend is down.
The Bullish Harami shows that the trend is pausing. It is a signal that indecision and uncertainty is causing the trend to lose momentum. The next candle is of importance too. If it is bullish again and there is a break of the high, this is good indication that the trend might be changing.
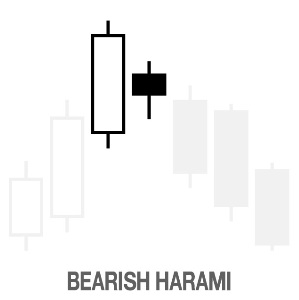
BEARISH HARAMI
The Bearish Harami is a reversal pattern and has a candlestick with a big white body followed by a candlestick with a small black body, completely covered by the first. The direction of the trend is up.
The Bearish Harami shows that the trend is pausing. It indicates that the buyers failed to push the price higher and that sellers may be taking control. If the next candle is bearish again and there is a break of the low, this is good indication that the trend might be changing.
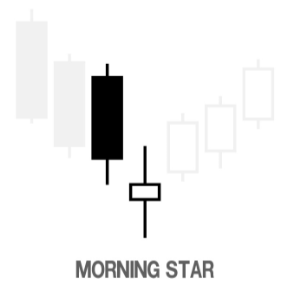
MORNING STAR
The bullish Morning Star is a reversal pattern and consists of three candlesticks. The first has a long black body, the second (the star) has a little body (white or black), which is lower than the previous body. The third candlestick has a large white body, which opens above the close of the preceding period and at a level close to that of the first black candlestick.
The star indicates weakness as the sellers were not able to drive the close much lower than the close of the previous period. This weakness is confirmed by the third candlestick, which must close well into the body of the first candlestick or even beyond it. The formation of this pattern is a possible signal that the market goes from bearish to bullish trend and usually appears when the market reaches a bottom.
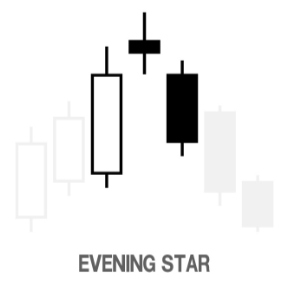
EVENING STAR
This bearish reversal pattern consists of three candlesticks. The first has long white body, the second (the star) has a small body (black or white) which is higher than the body of the white candle, and the third has a long black body at the levels of the first.
The Evening Star indicates weakness. Although buyers pushed the price higher, sellers were strong enough to bring it down. This bull weakness is confirmed by the third candlestick, which must close well into the body of the first candlestick or even beyond it. This pattern signals a possible reversal of the uptrend into a downtrend and marks a peak in the market.
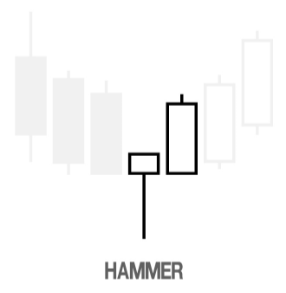
HAMMER
The Hammer is a candlestick with a small body and a large lower shadow. This is a reversal pattern. The size of the shadow should be at least twice the size of the body, and the upper shadow should be very small or missing. The body can be white or black. The candlestick must appear in a downtrend.
This is a sign for a bottom forming. It shows that although the bears pushed the price lower than the previous candle, the bulls managed to pull it up and close near the opening. The sharp rebound from the low means rejection of that price as the bears are losing control and the bulls are gaining momentum.
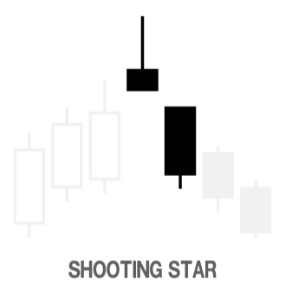
SHOOTING STAR
The Shooting Star is a candlestick with a small body and a large upper shadow. This is a reversal pattern. The size of the shadow should be at least twice the size of the body, and the lower shadow should be very small or missing. The body can be black or white. The candlestick must appear in an uptrend.
This pattern shows that despite the sharp move that led the price higher than the previous period, enough selling appeared and pushed the price down to close near the opening level. This signals the possible end of the bullish trend and a beginning of a bearish trend.
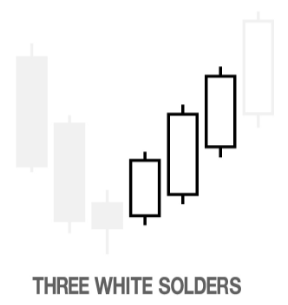
THREE WHITE SOLDIERS
The bullish Three White Soldiers pattern consists of three consecutive long-bodied white candlesticks that open within the previous candle's real body and close above the previous candle's high. The upper and lower shadows should be small.
This is a strong reversal pattern. It shows the bulls are buying hard and the downtrend is weakening. It shows a possible end of the bears’ reign and a beginning of the bulls’ time.
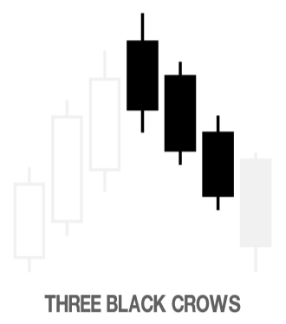
THREE BLACK CROWS
The Three Black Crows pattern consists of three consecutive long-bodied candles that open within the real body of the previous candle and close lower than the previous candle. The upper and lower shadows should be small.
This is a strong reversal pattern. It indicates weakening in the uptrend as sellers are in control for three consecutive periods. It marks the possible end of an uptrend and a start of a downtrend.
CONTINUATION CANDLESTICKS PATTERNS
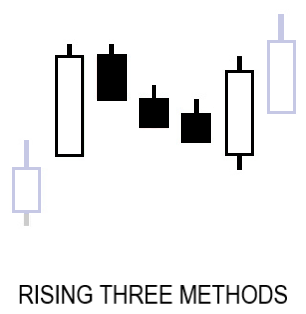
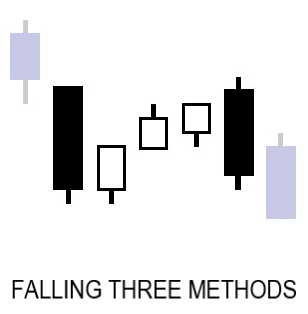
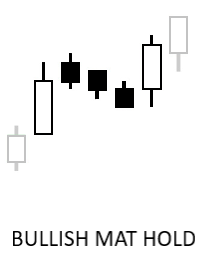
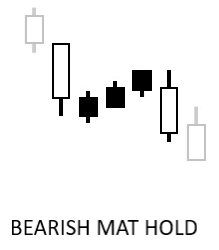
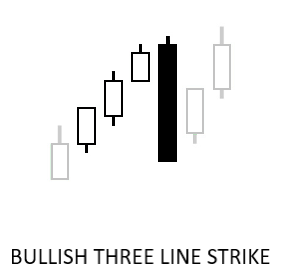
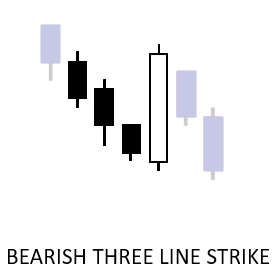
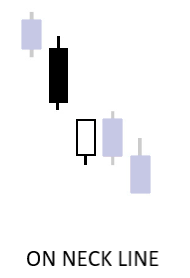
These patterns indicate some uncertainty in the trend. They too are only valid within a clear trend. The time during the formation of the continuation pattern is a time when neigher the bulls, nor the bears manage to take the upper hand. After the pattern is fully formed, the trend usually continues its path, without changing directions.
Here are some examples of continuation patterns.
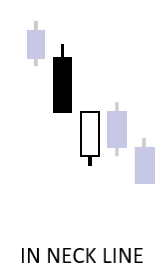
INSIDE BAR
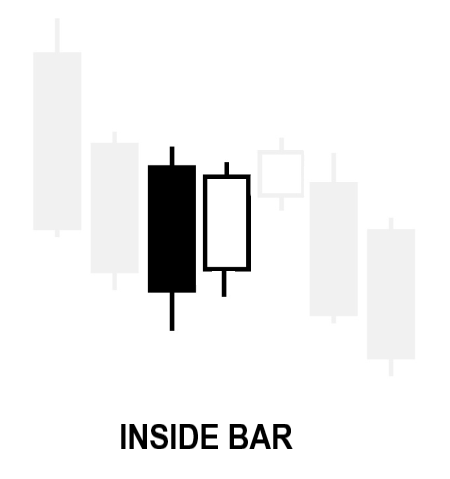
The Inside Bar is a continuation pattern. It can appear in both uptrend and downtrend and consists of two candles. If the trend is going down, the first candle of the Inside Bar is black. The second is white, with a lower high than the black candle’s high, and a higher low than the black candle’s low.
The Inside Bar pattern shows indecision in the market. Neither the bears, nor the bulls were willing to push the price in some direction. This looks a bit like a reversal-trend situation, but the typical outcome is continuation of the trend, sometimes with a big move.
DOJI
The Doji is a candlestick that has very small or flat body. Depending on its shadows, the doji can be several types.
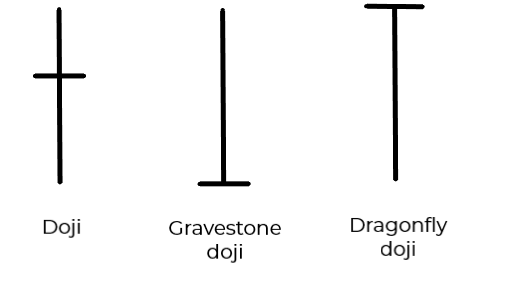
The standard Doji, or long-legged Doji, looks like a cross, with shadows extending both ways. It shows great indecision in the period. Trading was very active, the price was pushed high up and low down but, in the end, closed at, or very near, the opening. This candle can appear in both uptrend and downtrend.
The gravestone Doji opens at its lowest point. Bulls pushed the price up, but bears resisted and took it down to close at the starting point. This candle usually appears in an uptrend and may mark its ending.
The dragonfly Doji is opposite to the gravestone. The candle opens at its highest point. Sellers managed to push the price low, but then the buyers took control and returned the price back to square one. The dragonfly Doji usually appears in a downtrend and indicates a possible turn upwards.
Doji candles are interesting because they show a period where neither the bulls, nor the bears had the upper hand. Doji can form at the test of a support or a resistance level. It does not point at what the outcome will be, but it does mark a potential change.
There are dozens more patterns that can be useful to traders. With time and with practice you will add more and more to your arsenal. They provide a clear advantage that should not be ignored.


