RETESTER GUIDE
StrategyQuant X
CONTENT
» BASIC / HIGHER BACKTEST PRECISION
» BASIC / MONTE CARLO TRADES MANIPULATION
» STANDART / BACKTESTS ON ADDITIONAL MARKETS
» STANDART / MONTE CARLO RETEST METHODS
» EXTENSIVE / OPT.PROFILE/SYS.PARAM.PERMUTATION
» EXTENSIVE / WALK-FORWARD OPTIMIZATION
» EXTENSIVE / WALK-FORWARD MATRIX
INTRODUCTION
Retester is the powerful backtesting engine of StrategyQuant. Its main purpose is to find robust strategies that are not over-fitted to the history data that was used for their development.
Over-fitting, or curve-fitting, is one of the biggest problems, when generating a strategy. It means to have strategies that are too adjusted to the history data on which they were developed. Although they will show excellent results in the building process, they most certainly will fail, when tested on other data (e.g. other period). That is why robustness tests are a very important concept in machine-learning based strategy development. Retester has many cross-checks that aim to provide the tools and the evaluation methods necessary for filtering out these over-fitted candidates.
Retester has three main sections on its main screen:
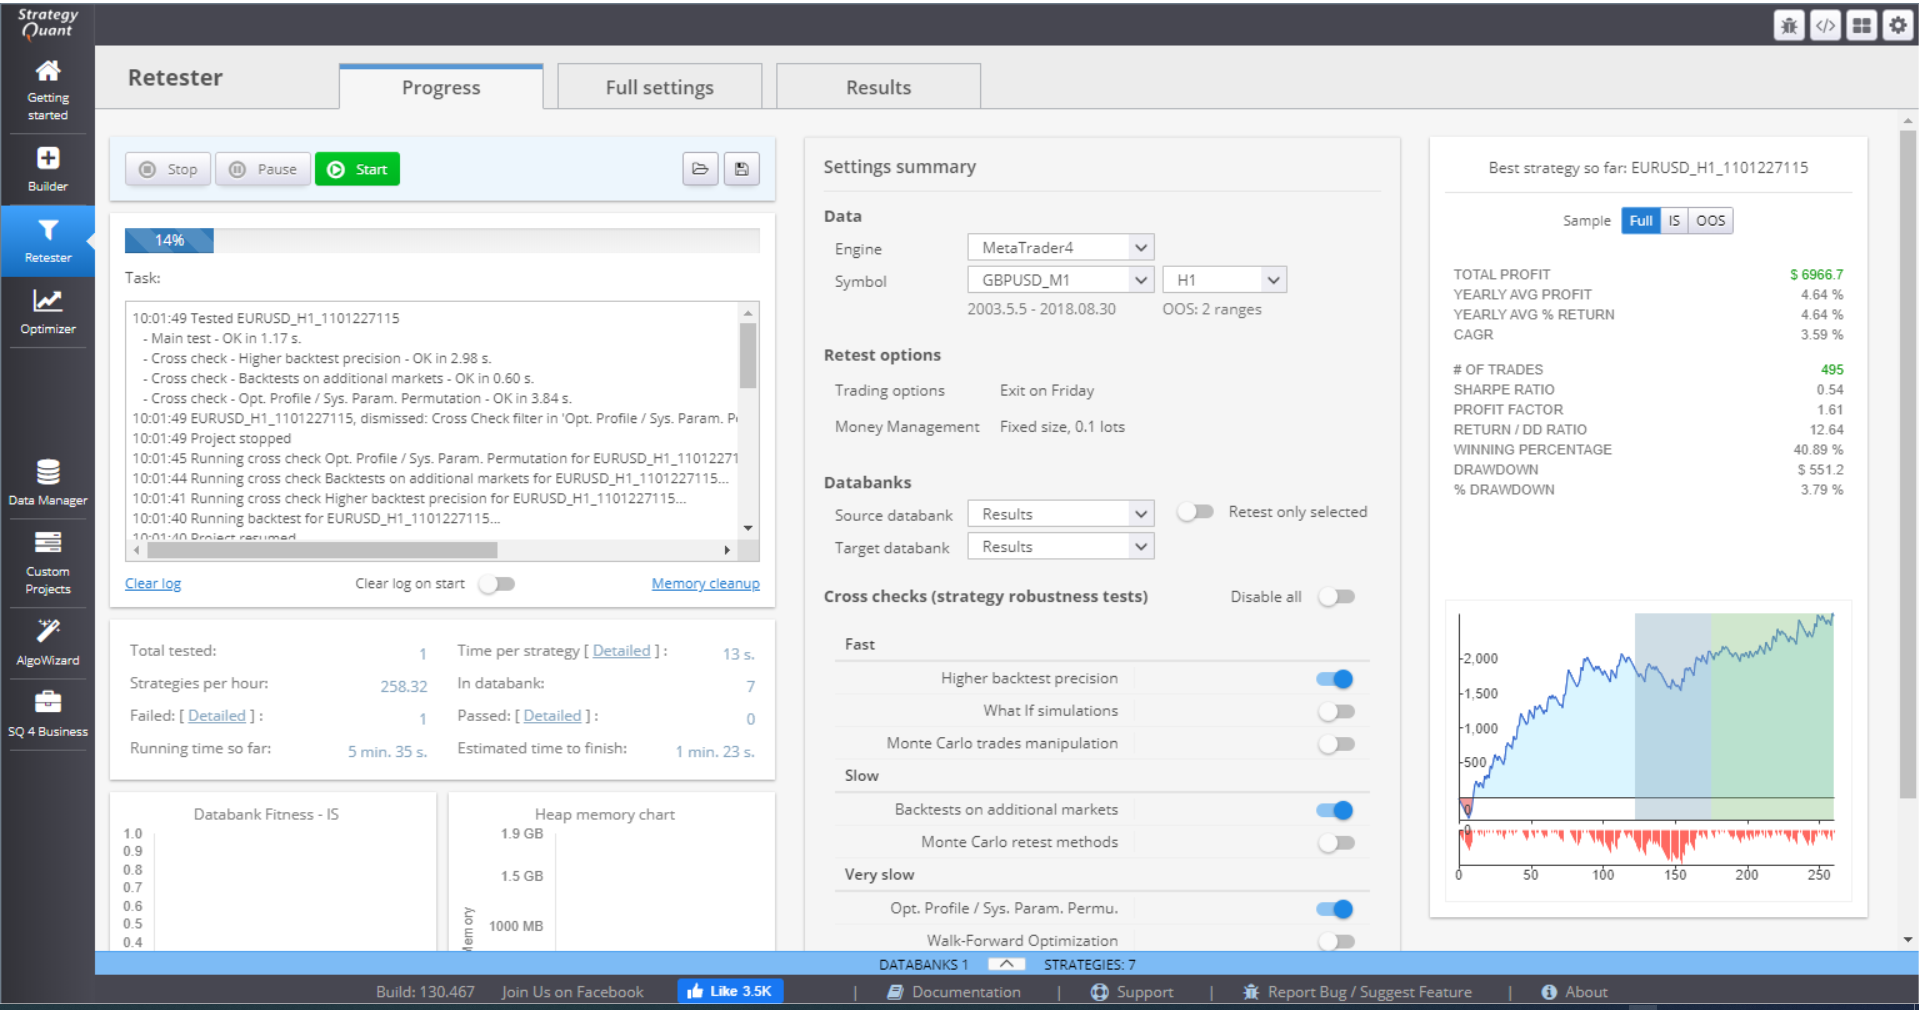
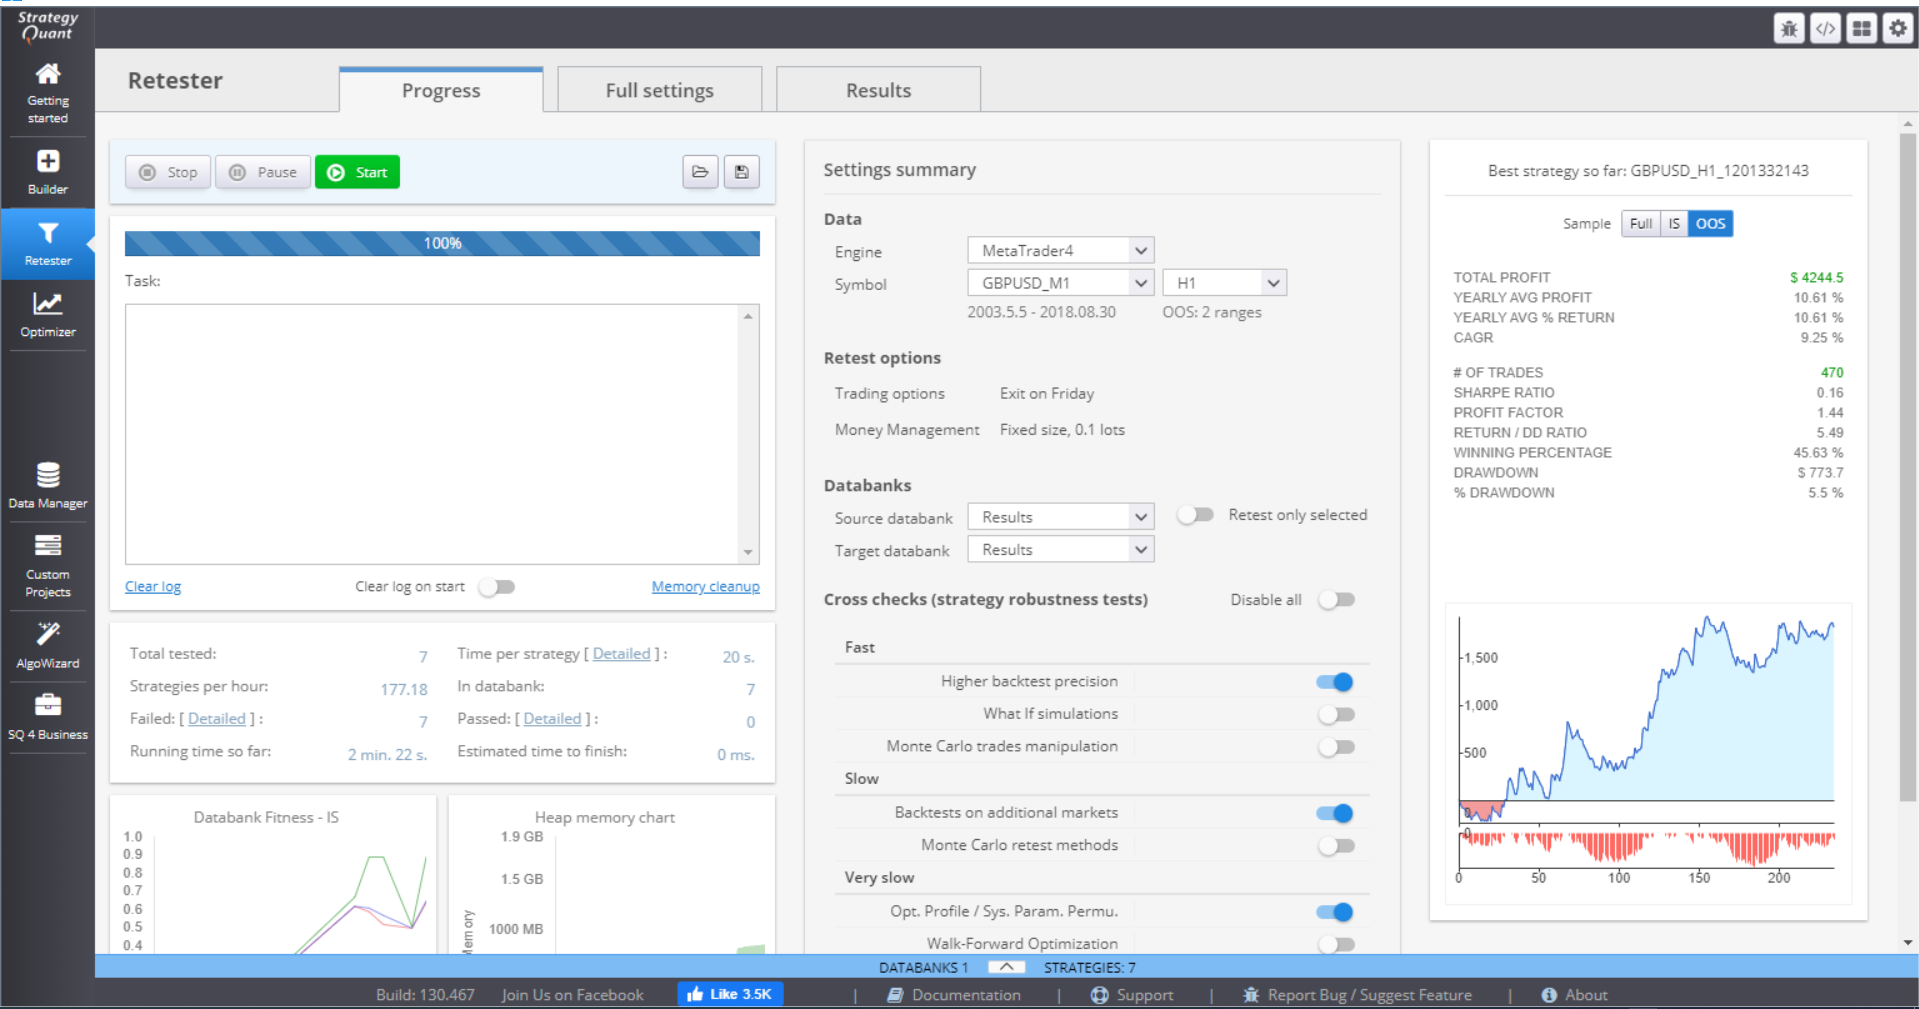
Progress (Engine) tab – this is where you can start or stop the task and follow its progress. You can monitor the statistics or quickly change a setting.
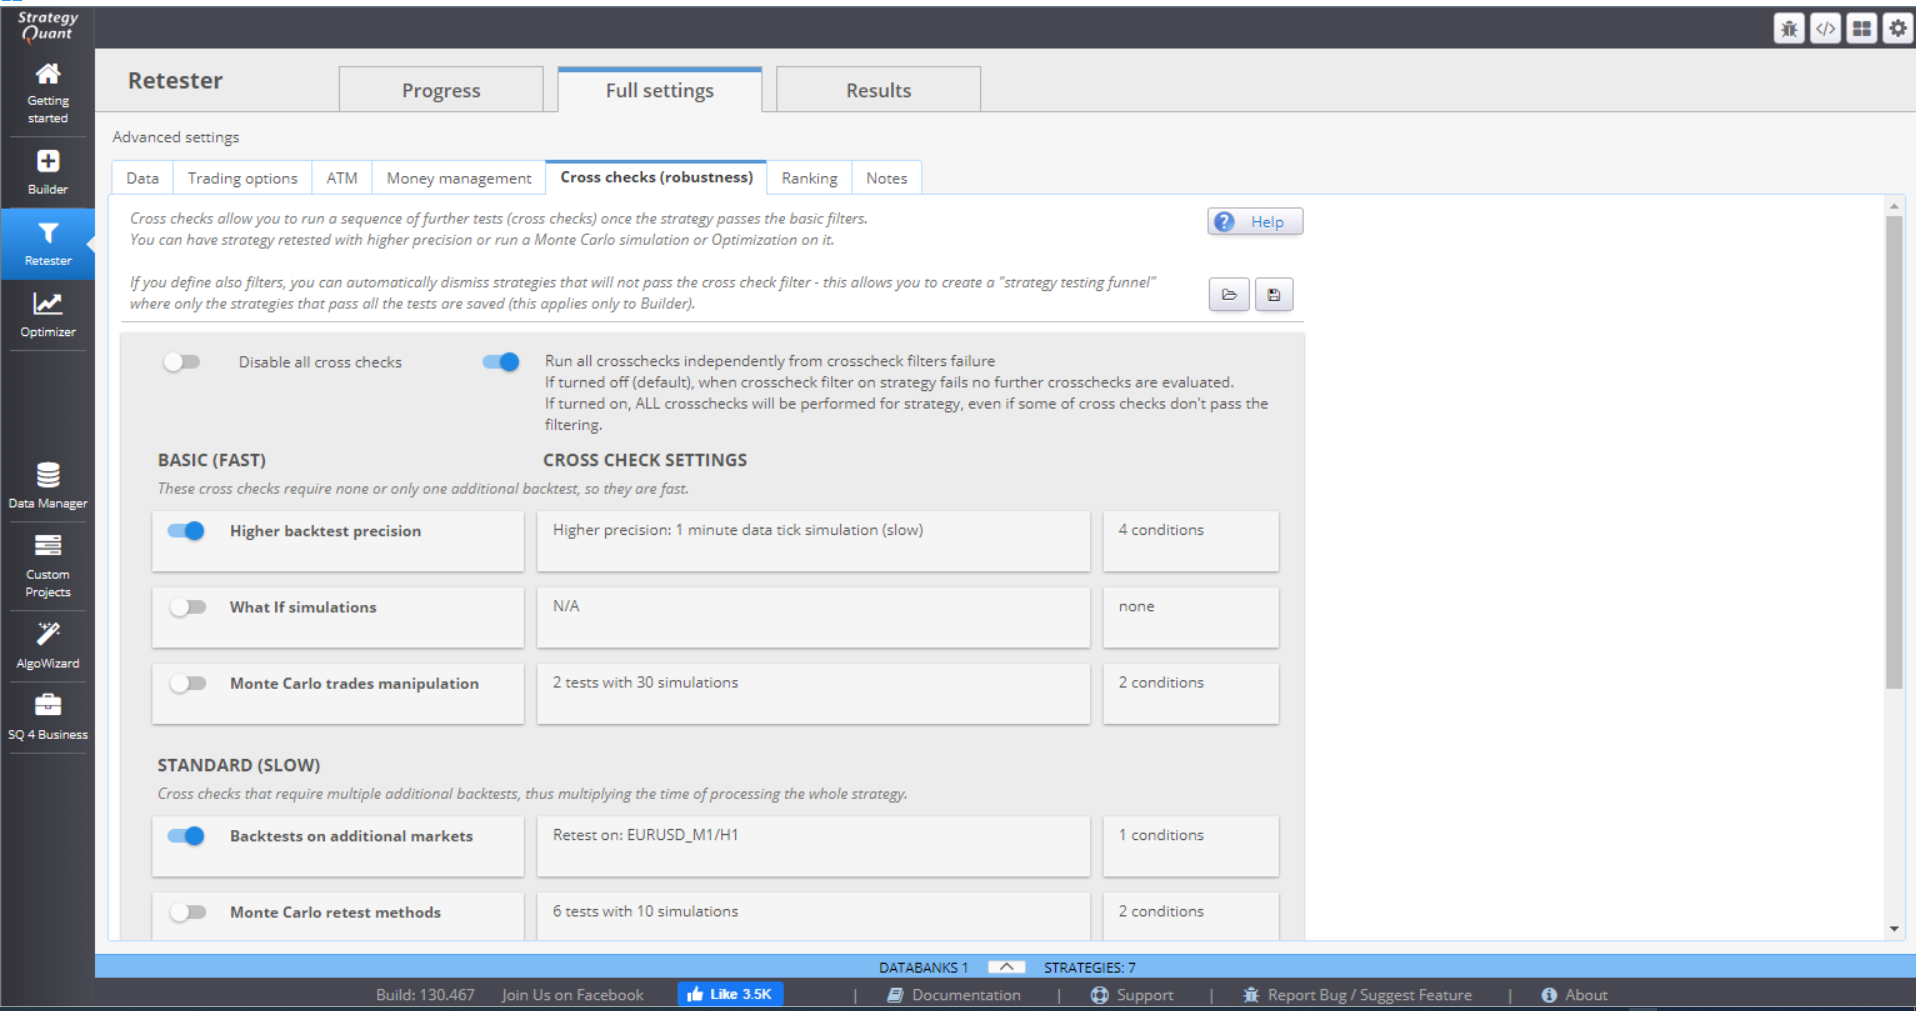
Full Settings tab – these are all the settings that can be configured for retesting your strategies.
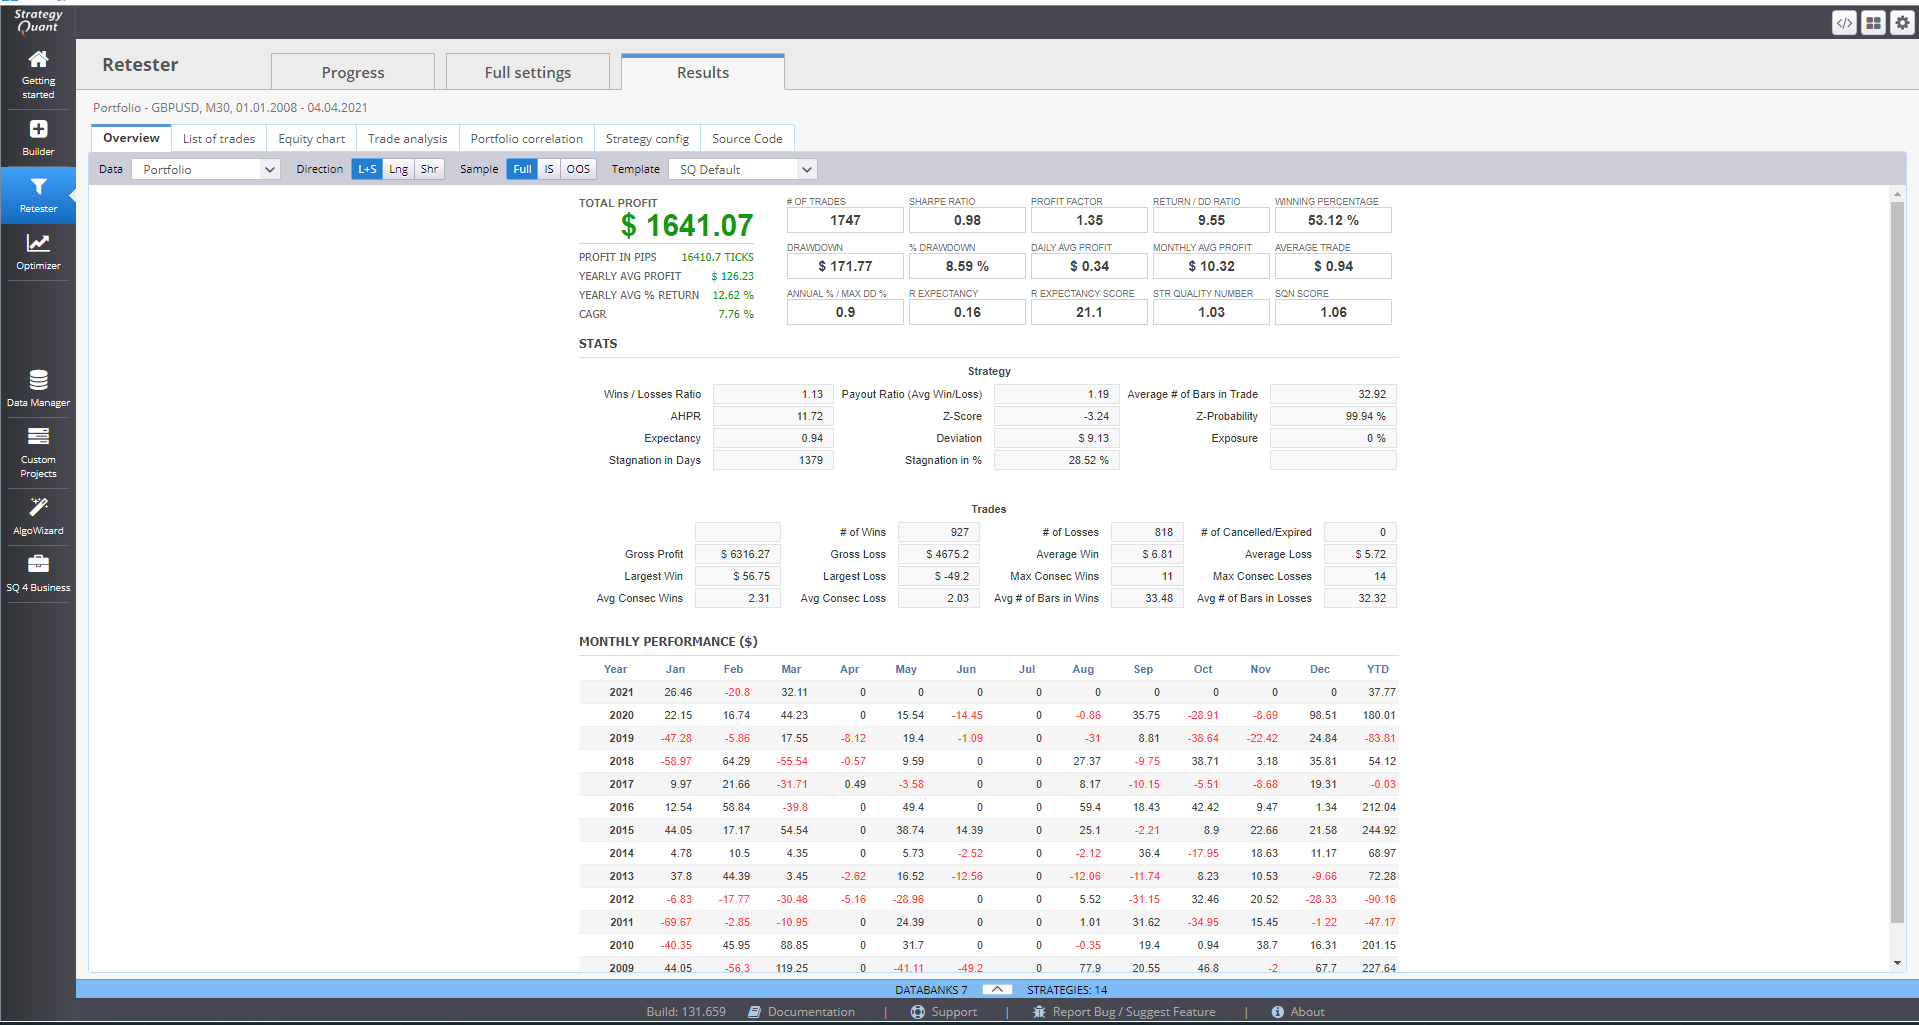
Results tab – shows the summary of the strategies that are backtested and their statistics.
PROGRESS SECTION
This section shows a summary of the settings applied to the current strategy backtest processes, as well as their overall progress and summary.
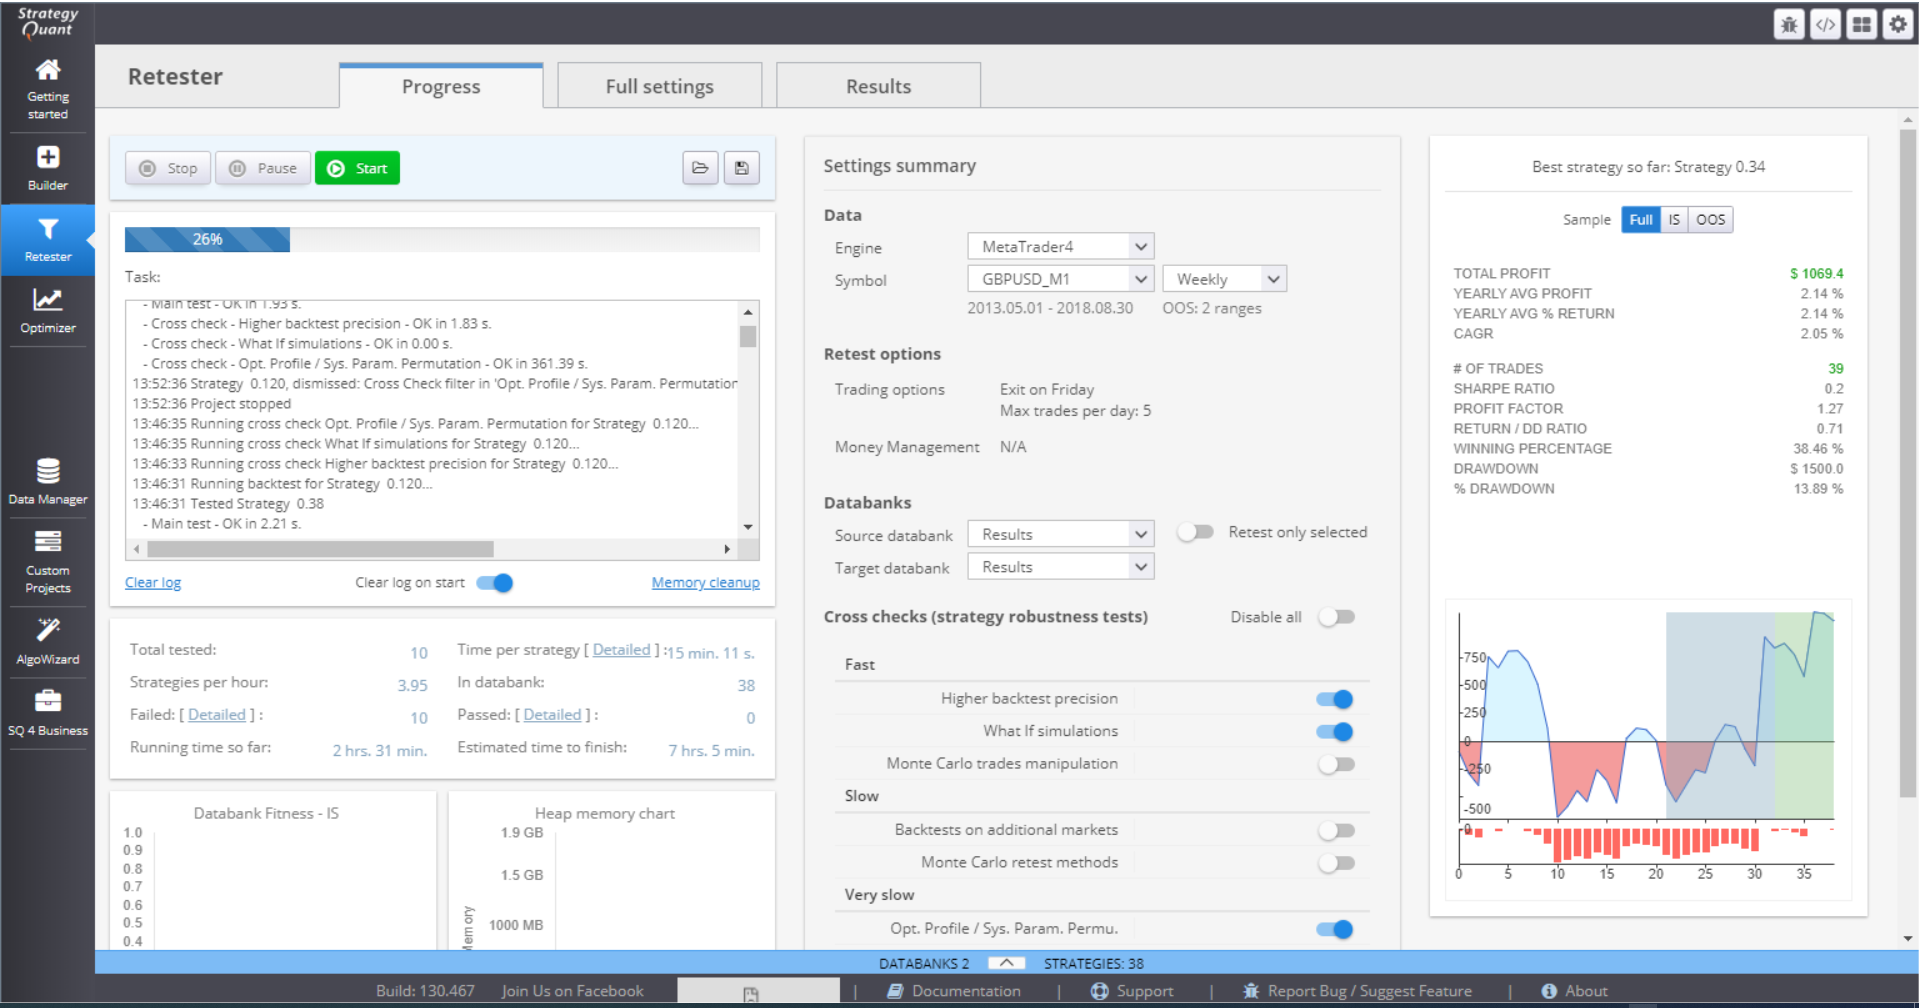
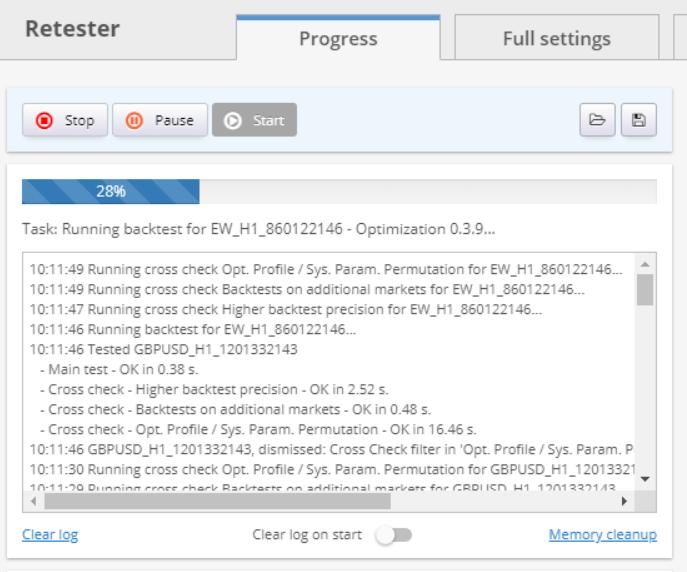
The first section of the screen contains a log where you can see each retested strategy and its assessment according to the backtest success criteria. You can Stop, Pause and Start the backtesting process using the buttons on the top of the section. You can Load settings, or Save your progress.
There is a summary of the tested strategies that gives details like time elapsed on one strategy, failed and passed tests, time since process start, etc.

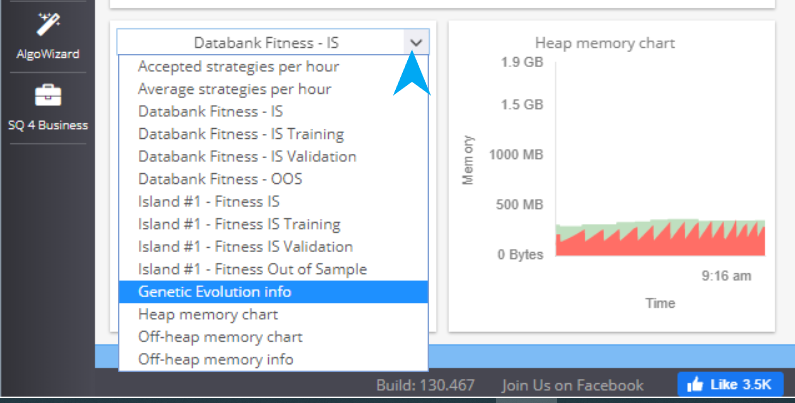
The charts on the bottom are configurable so you can choose what to see.
You can make some quick adjustments to the settings in the Settings Summary part.
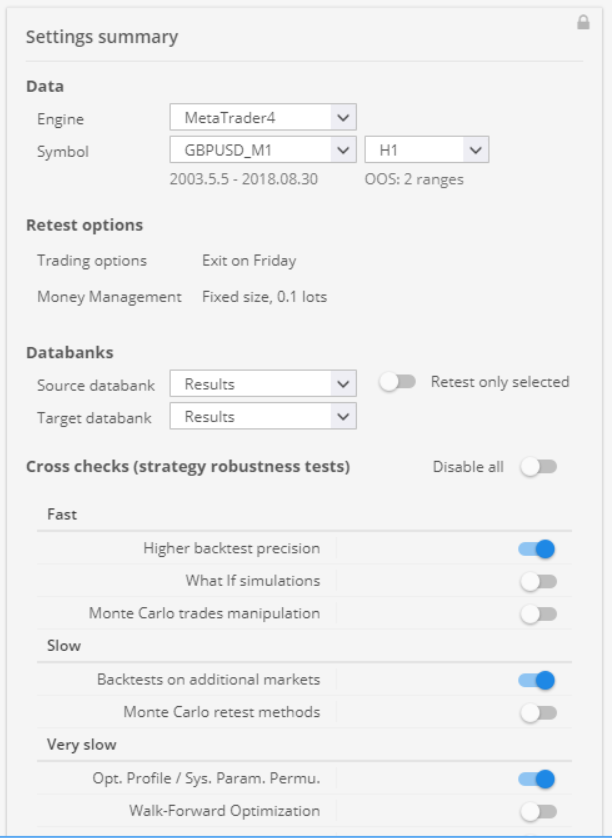
Data holds information about the chosen trading platform, symbol and timeframe. Retest options show a brief overview of the set parameters. Cross checks panel is an easy way to toggle on and off the strategy robustness tests.
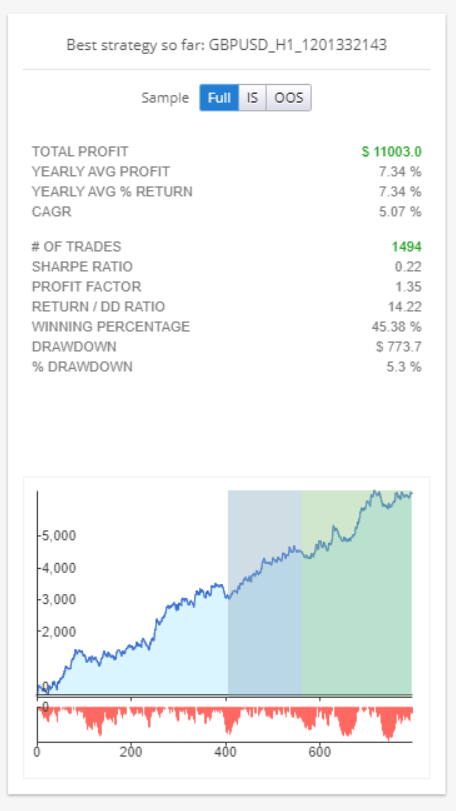
The third panel is Results. You can see some statistics of a chosen strategy here. If you click on the panel, it’ll lead you to the Results menu, where you can get full details of the strategy.
Databank can be accessed by clicking the arrow in the middle/bottom part of the Progress window. It stores the currently backtested strategies.
You can perform multiple actions with the data. You can sort it using different parameters, save or load data. If you double-click an item, its details are opened in the Result section.

FULL SETTINGS SECTION
This is where you choose all components that would be included in the strategies backtests. You set their values, boundaries, conditions, restrictions. You choose the cross checks and the filtering criteria for the strategies.
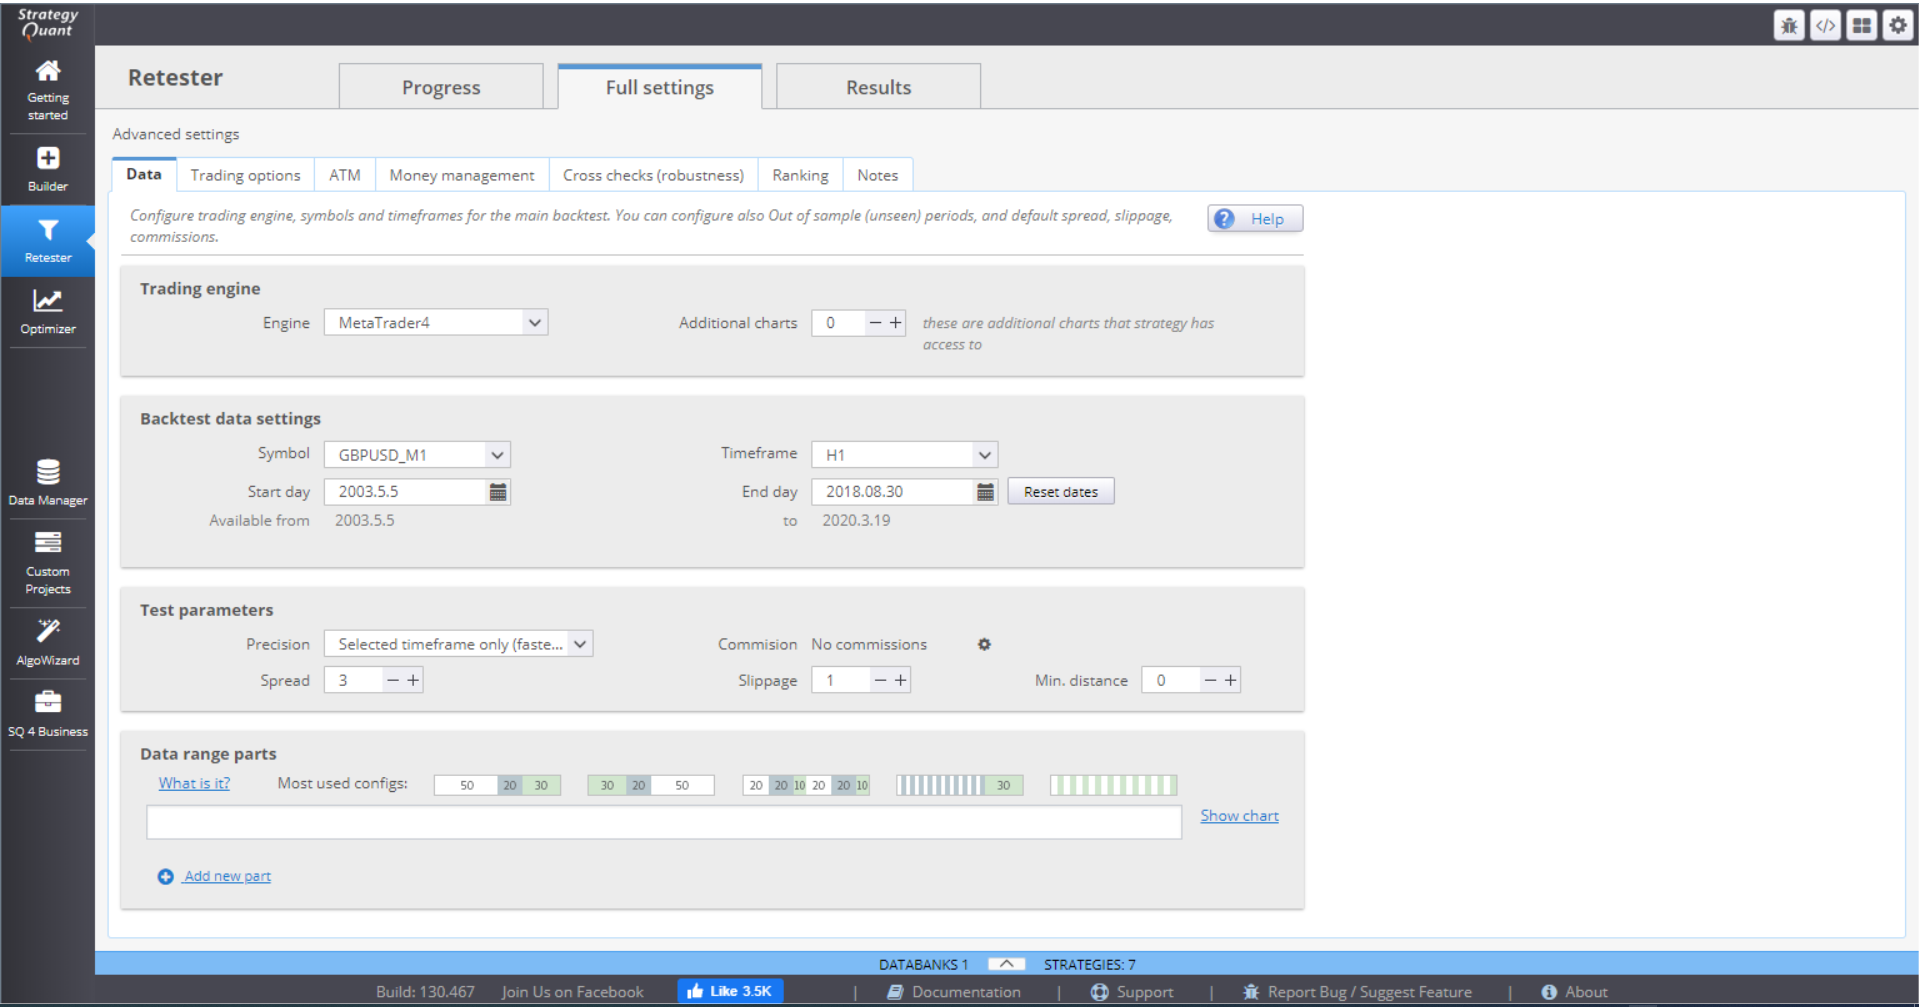
DATA
This menu contains the settings for your backtests.
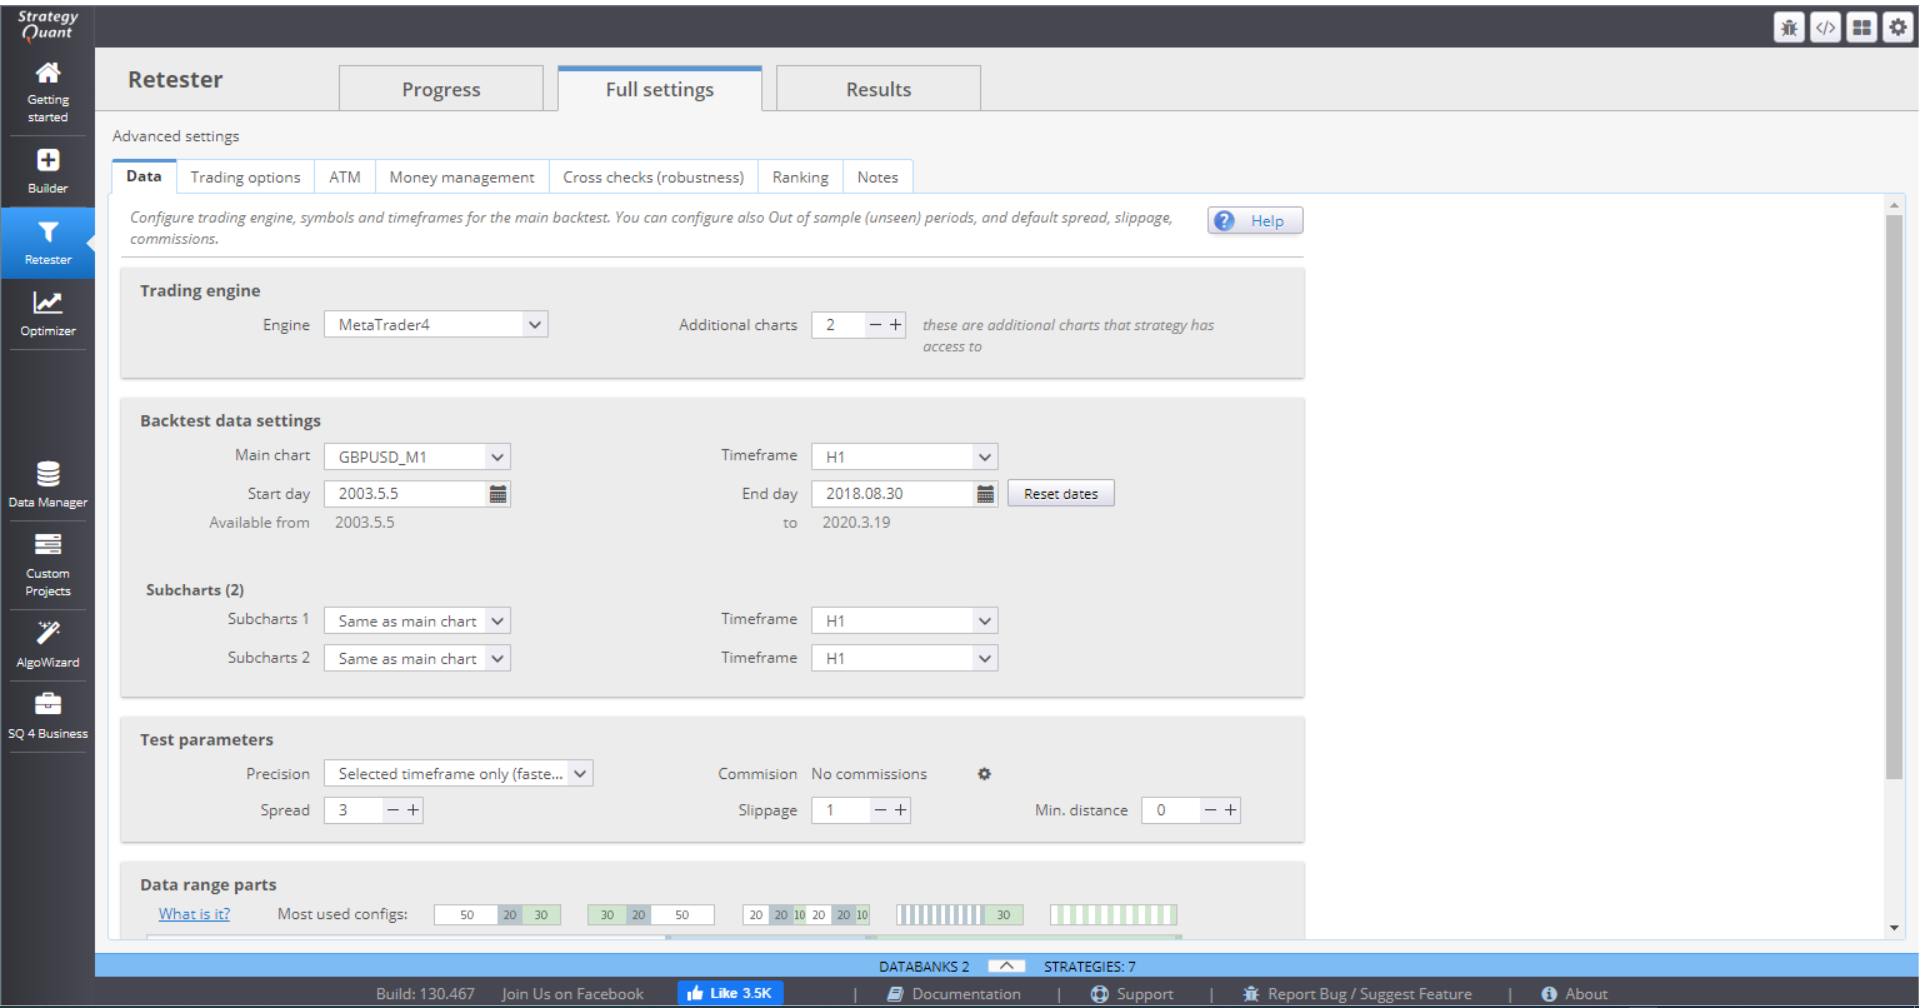
› In Trading engine, you can choose the trading platform you want to work with and indicate how many additional charts you will use.

› Backtest data settings allow you to choose symbol, timeframe and time period for the backtests. There are separate settings for the main chart and for the sub charts.

› Test parameters - here you specify the precision of the data.

There are 4 options for setting the Precision:
› Selected timeframe only generates 4 ticks per bar – at Open, Close, High and Low for the period.
› 1 Minute data is more precise. It uses 1-minute data (if available) and generates 4 ticks per minute. This way it simulates price changes within the bar.
› Real tick – custom spread uses real tick data (if available) for the Bid price. It calculates the Ask price based on the spread that you specify.
› Real tick – real spread uses real tick data with real Bid and Ask prices. This is the slowest backtesting method of the four, so it should be used for final verification only.
You can choose to set the Commission rate.
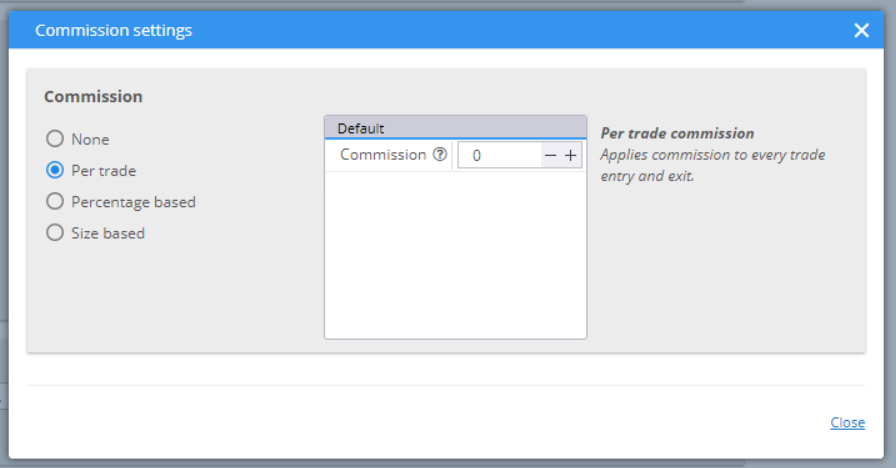
The Spread value would be used to calculate the Ask price if you choose Real tick – custom spread for precision method. Slippage adds a specified number of pips to the opening or closing price of your positions. Min.distance is set for your pending orders. Some brokers set limits on the distance from the current price when placing limit or stop orders.
Data range parts provides the opportunity to split the data set into different parts. You can choose one of the default configurations, or manually structure one of your own.

In Sample Training (IST) is the white part of the history data where the strategies are evolved, using Genetic evolution. Their fitness is calculated here and that determines their rank (the higher the value, the better the strategy). The best candidates have the highest probability to be chosen for crossing or mutation processes. This ensures that the next generation is better than the previous.
In Sample Validation (ISV) part determines whether the strategy still holds its fitness. This is where the Restart of the genetic process is done, if the fitness stagnates.
Out of Sample (OOS) is a part of the history data that is unknown to the evolution process. It simulates real trading conditions for the strategies.
No Trade is a part where the strategy will not trade. This could be used to skip sections with low volatility, for example.
You can change the arrangement and the duration of each period. You can add new periods, or remove unnecessary ones. The optimal option is to split the data into 3 parts – IST, ISV and OOS.

TRADING OPTIONS
In Build and Trading options you can specify rules for the opening and closing of trades.
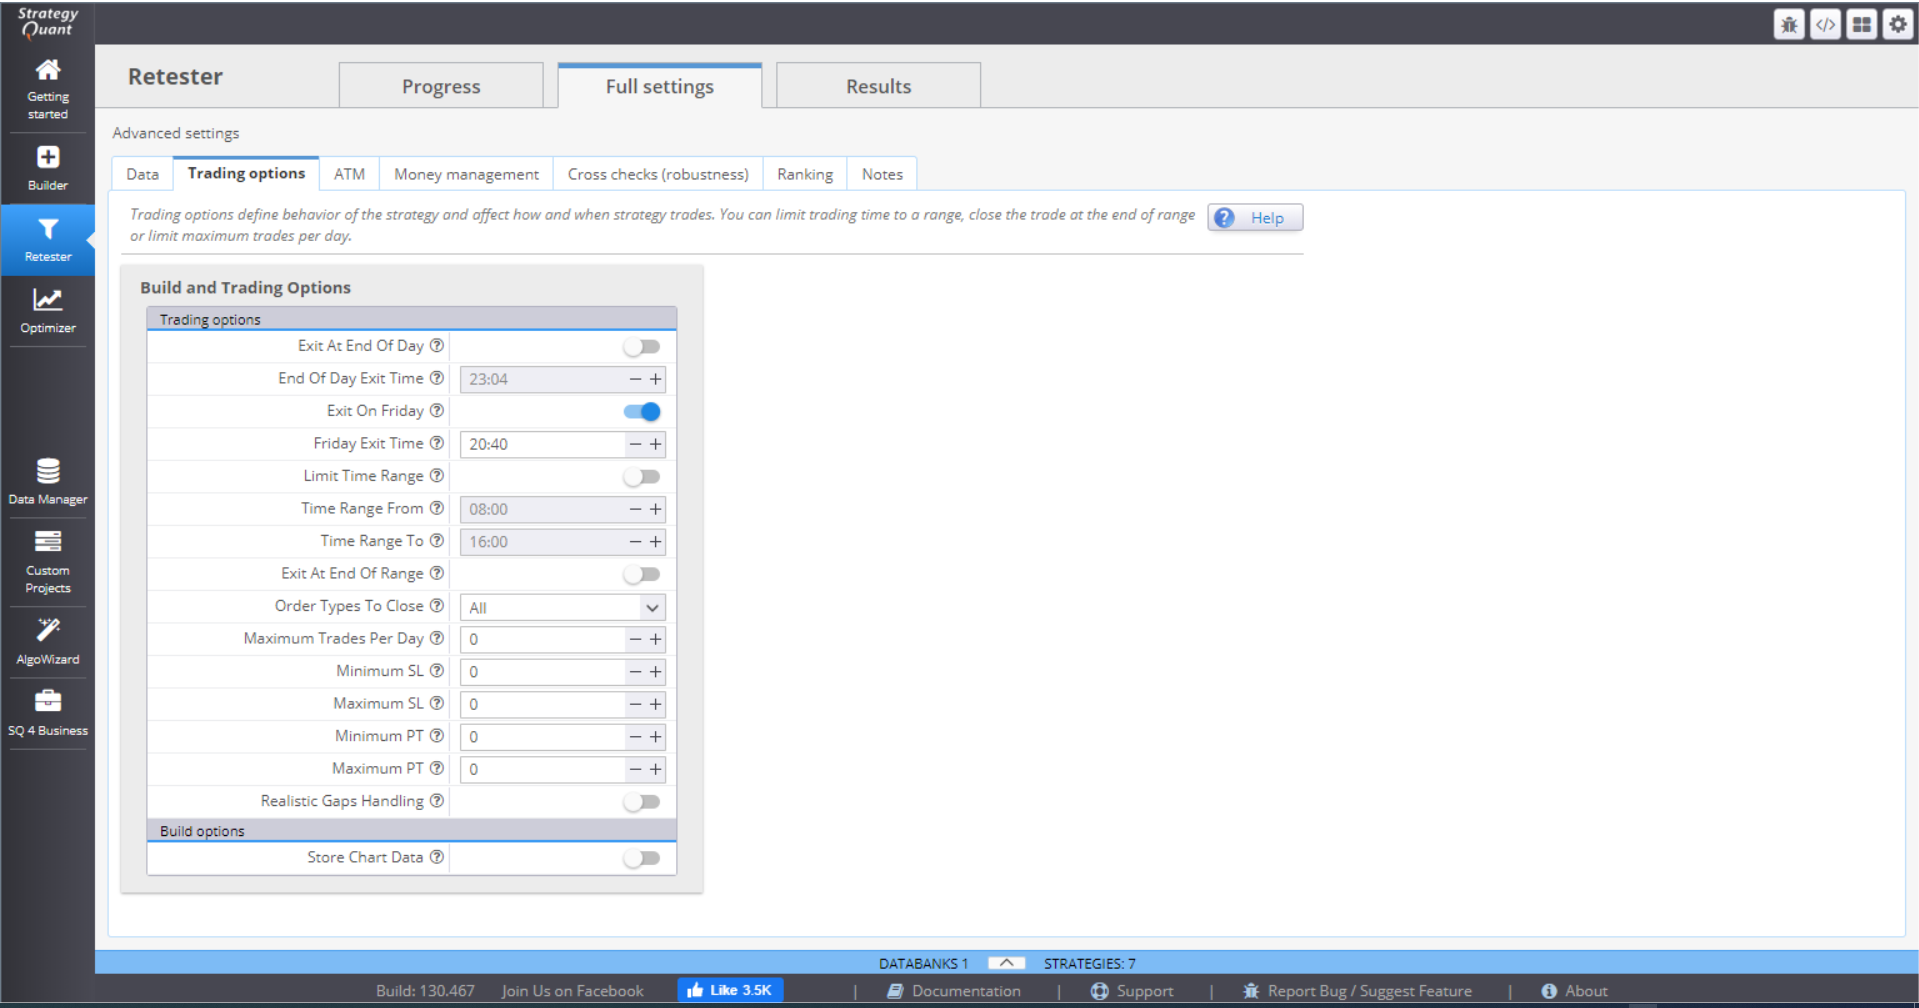
You can choose to exit all positions at the end of the day, or on Friday, and specify the exact time.
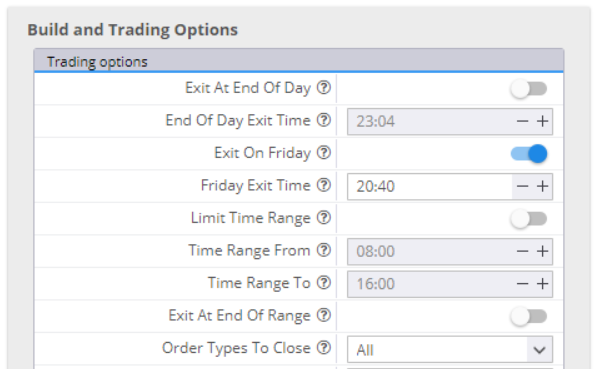
If you switch Limit Time Range on and fill in the range, the strategy will open trades in this time period only. You can choose to close the open positions at the end of the range. You have the option to close all positions, live trades only or pending trades only. If you leave that inactive, the strategy will leave your positions open.
If you want to, you can limit the maximum number of trades per day.
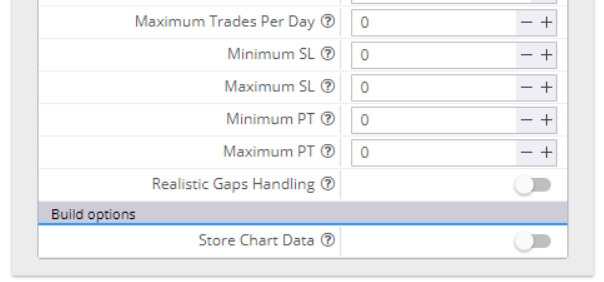
You can set minimum and maximum values for the Stop Loss and Take Profit orders. In this case, if the random generating process selects values beyond the range, they will be automatically cut to fit in. Zero in the value field means random value.
Realistic Gaps Handling is a way to handle gaps more realistically than the MetaTrader4 backtester. The latter would fill a pending order at its limit/stop price, which is not accurate. In real trading the order will fill at a price level after the gap.
If you choose to Store Chart Data, you will have complete chart data of your backtest, with all the indicators and all the trades on it.
ATM
The Advanced Trading Management allows you to configure multiple exits to your open positions. Using this option will disable all other exit options – Profit Target, Trailing Stop, etc. It will only use the Stop Loss settings and the ones configured here, in ATM.
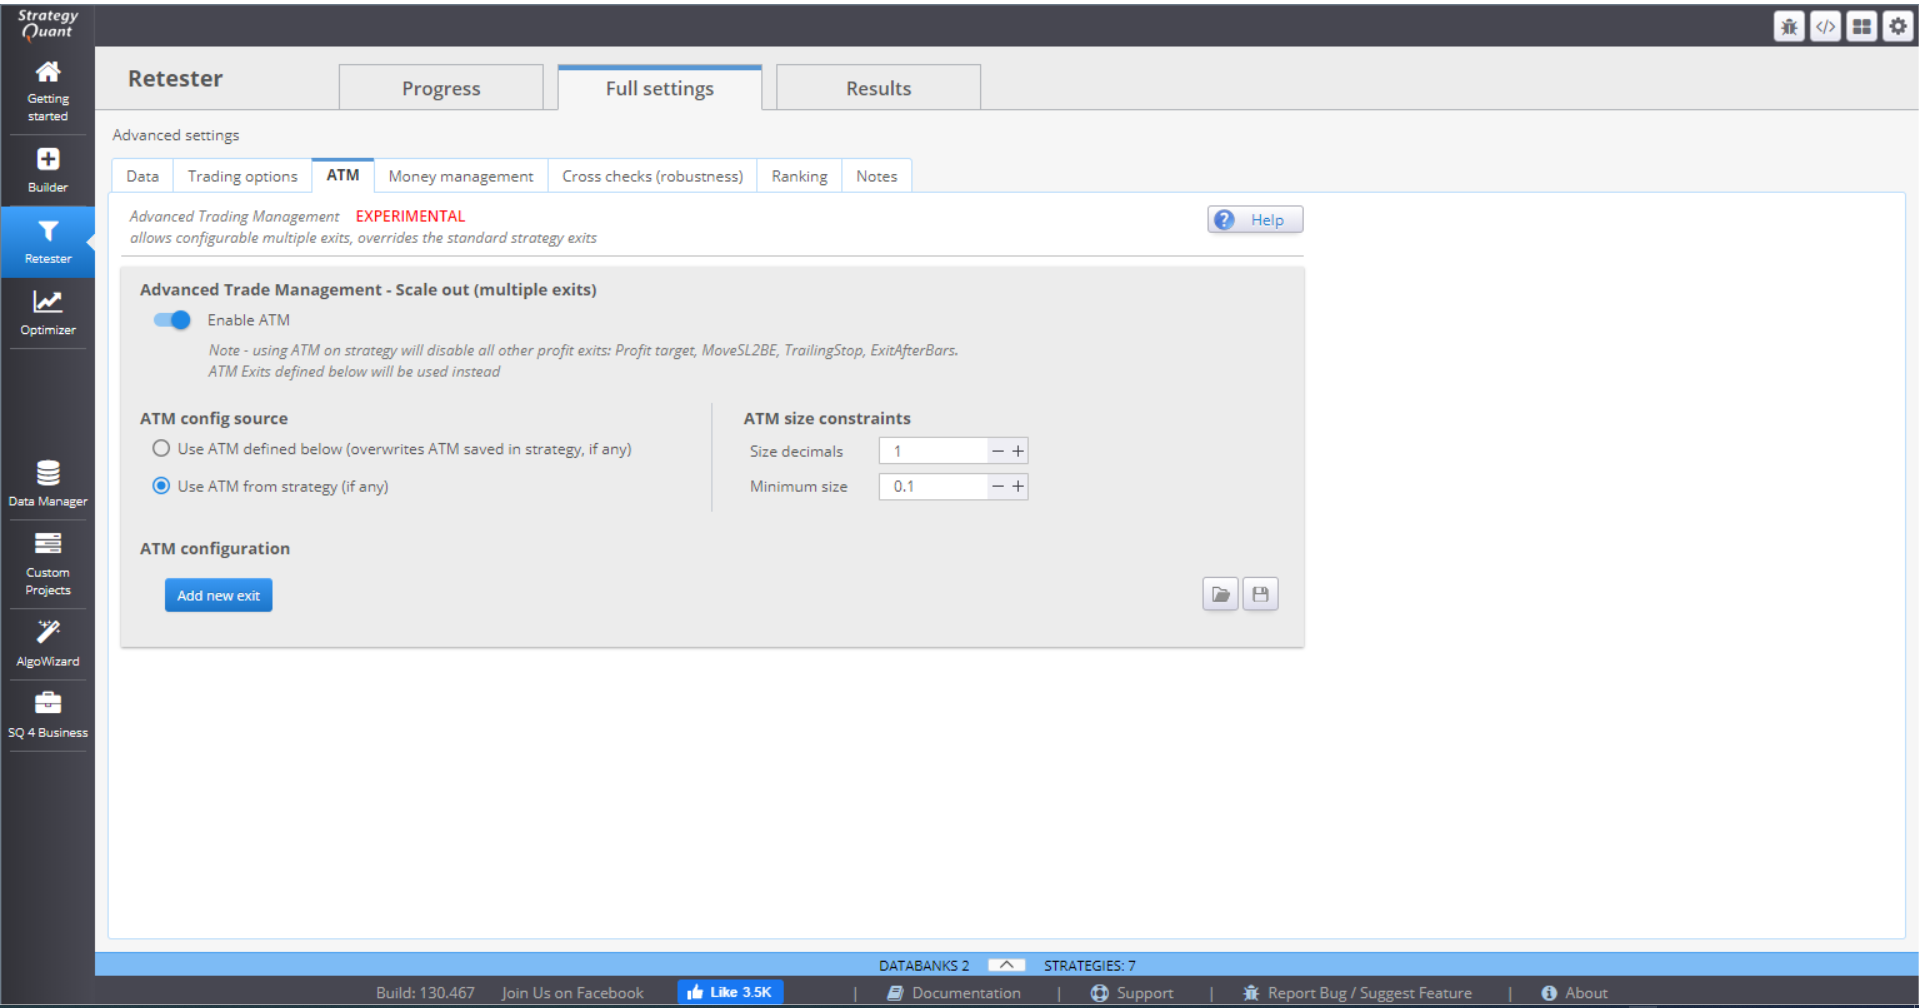
The idea is to close one part of the trade quickly after the profit is enough to cover the costs and the risk. The other part of the trade is left open to reach further profit target(s).
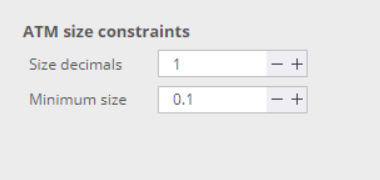
ATM size constrains give some rules to ATM when computing the position parts. Size decimals gives instructions how to round the parts size. Minimum size is the smallest acceptable size for one part.
Then you can configure the rules by clicking the Add new exit button.
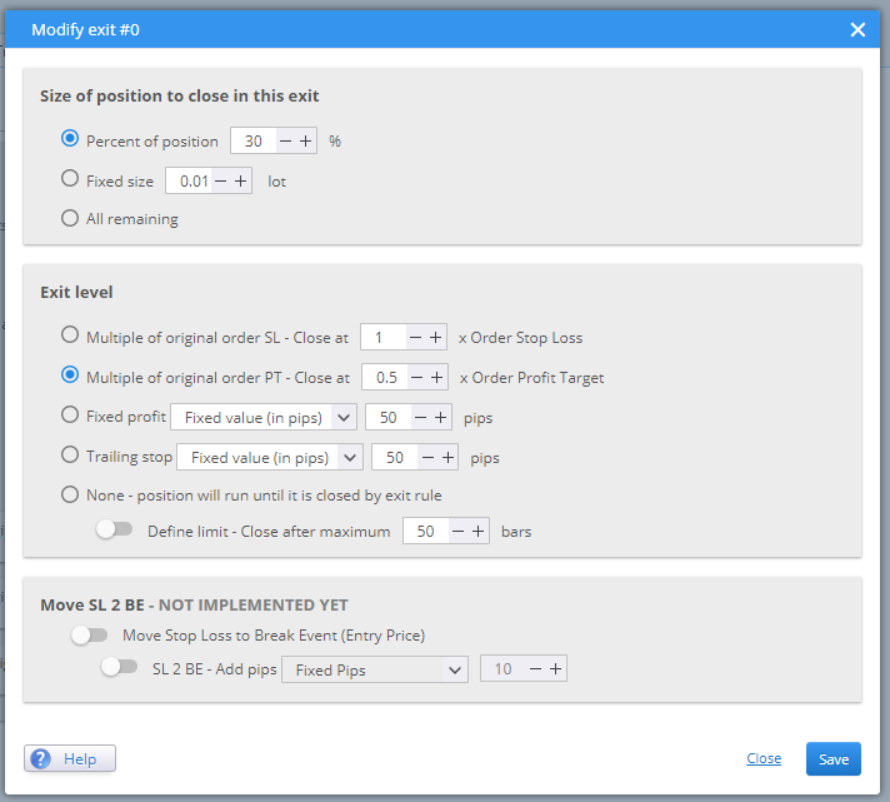
Size of position to close in this exit gives you three options. Choose whether you want to compute the parts using a percentage or a fixed size. All remaining is suitable for setting rules for the last part of the position.
Exit level is where you define when you want this part of the position to be closed. You can set it to be dependent on the SL or TP. Or choose it to be a fixed value. The last option is to close the part after a given number of bars.
When you configure the rules, they are saved and applied to your strategy.

MONEY MANAGEMENT
In this menu you configure the initial capital and the position sizing method.
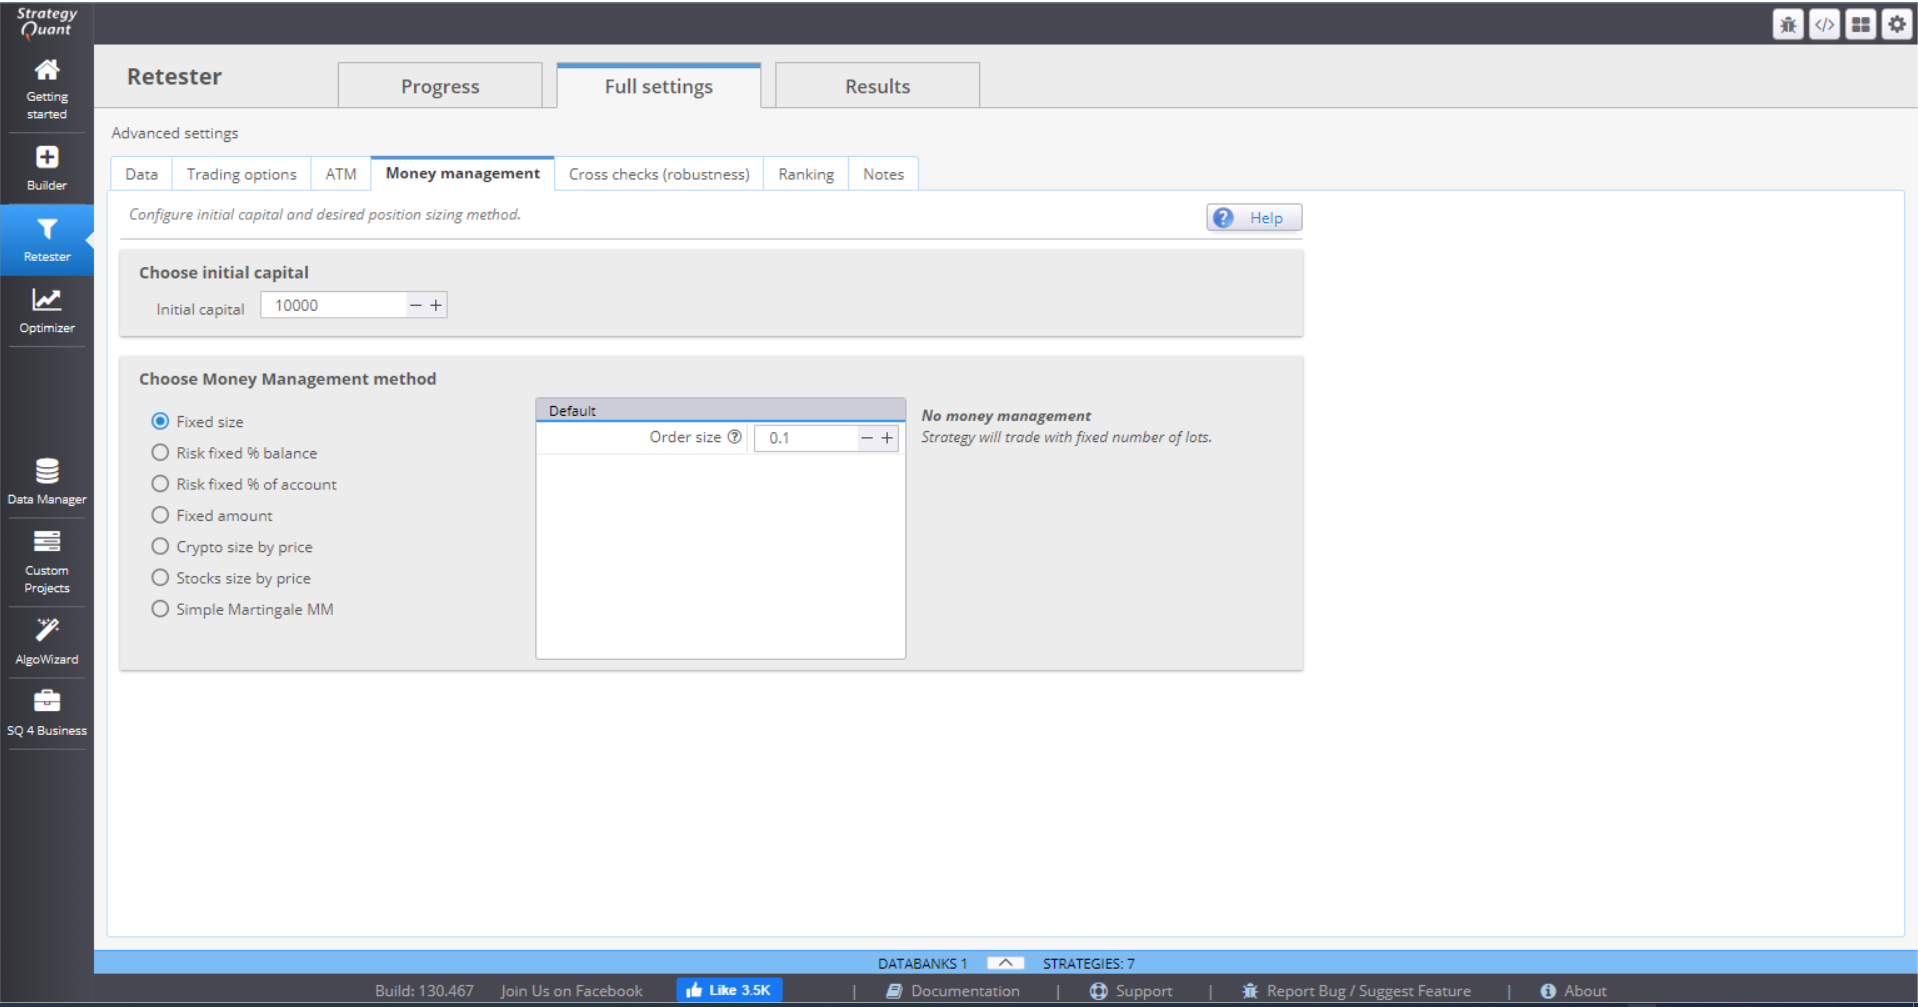
There are 7 MM methods to choose from:
⇒ Fixed size – the positions are opened using a fixed number of lots. This simple method is good when generating new strategies, as it gives you a clear overview of its real performance.
⇒ Fixed % of balance – this method will risk a certain percentage of your balance, meaning the money that you have in your account without including the profit/loss from open positions.
⇒ Fixed % of account – this will risk a certain percentage of your equity. The difference with the previous method is that the position size is calculated on balance, including profit/loss from open positions. This makes the method extremely sensitive to account changes, which is very effective money management.
⇒ Fixed amount – this method risks a fixed amount every time. It is a good way to test a strategy with Stop Loss, based on volatility (ATR), or when you want to compare strategies with different SLs.
⇒ Crypto size by price – this method is designed for crypto trading. You need to specify the exact number of characters after the decimal point that will be used. The initial capital is used by default, but you can set the method to use the account balance.
⇒ Stock size by price – the method is designed for trading stocks. Like the crypto method, the initial capital is used by default, but you can choose to use the account balance.
⇒ Simple Martingale MM – this method starts from a fixed size (in lots) and increases the position size by a set multiplier after each loss. The size is reset to starting point when the trade is closed for profit, or when the size exceeds a defined maximum size (in lots). There is an option to use separate logic for buy and sell orders.
CROSS CHECKS (ROBUSTNESS)
This is the most important part of Retester. You can set multiple cross checks to test how different small changes will influence the strategies performance.
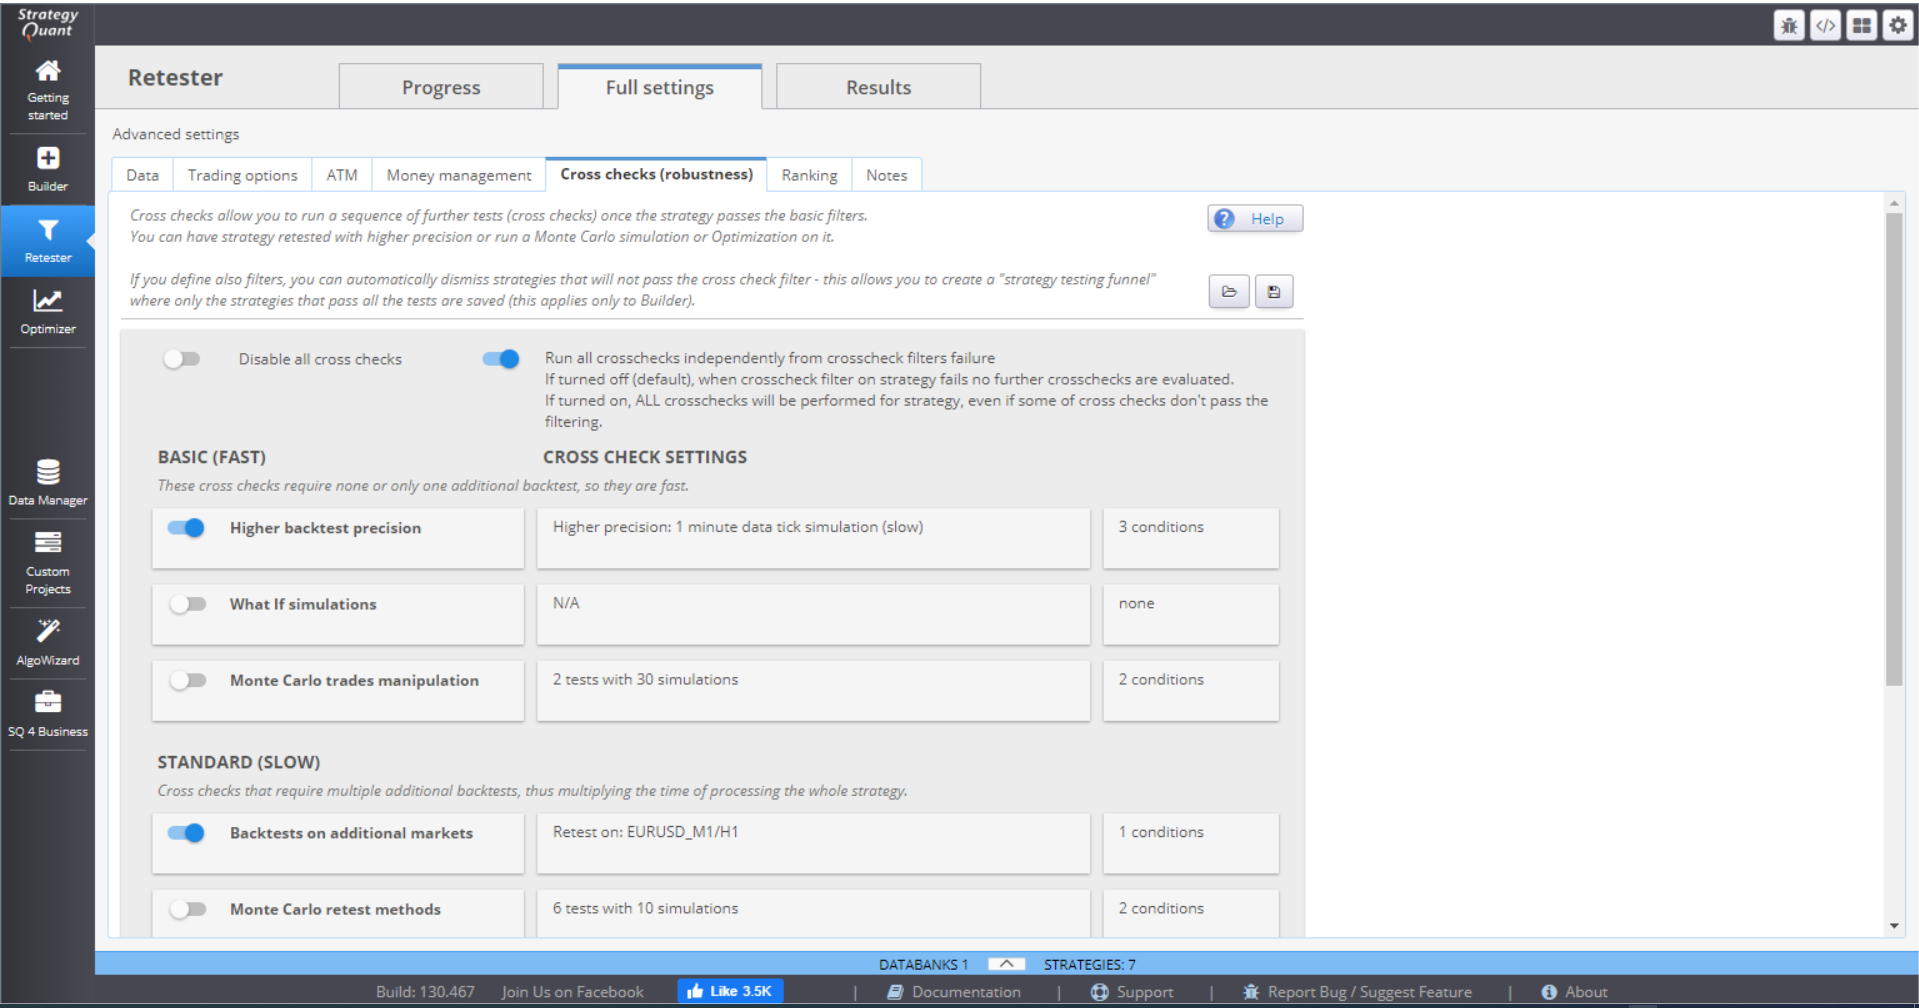
The different robustness tests are grouped based on how difficult and time consuming they are. They are performed one after the other starting from the basic to the more extensive ones. This forms a “testing funnel”, just like in Builder. But in Retester, poor performing strategies are not automatically dismissed. Instead, you have two options.

If you keep this switch off, Retester will stop testing a strategy if it fails on one of the tests. If you switch it on, Retester will perform all crosschecks on the strategy.
There are three most basic tests that you can perform.
» BASIC / HIGHER BACKTEST PRECISION
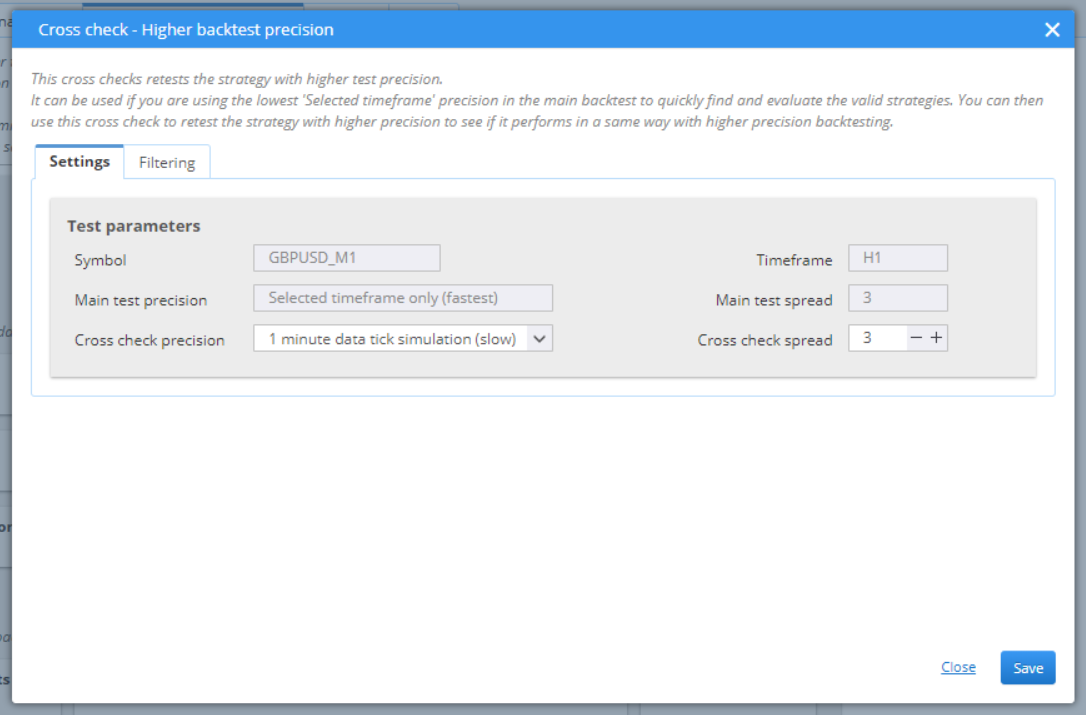
This is a simple and fast, but effective test. It tests the data on the same symbol chart, just uses higher precision.

When generating your strategies, it is better to use the fastest timeframe precision. This way you can optimize speed, while still having basic filtering of the bad candidates. Once the generation is done, Retester is the place to test them further and in more depth.
The settings of the test are configurable. You can choose the precision. It is advisable to set this to 1-minute data tick simulation.
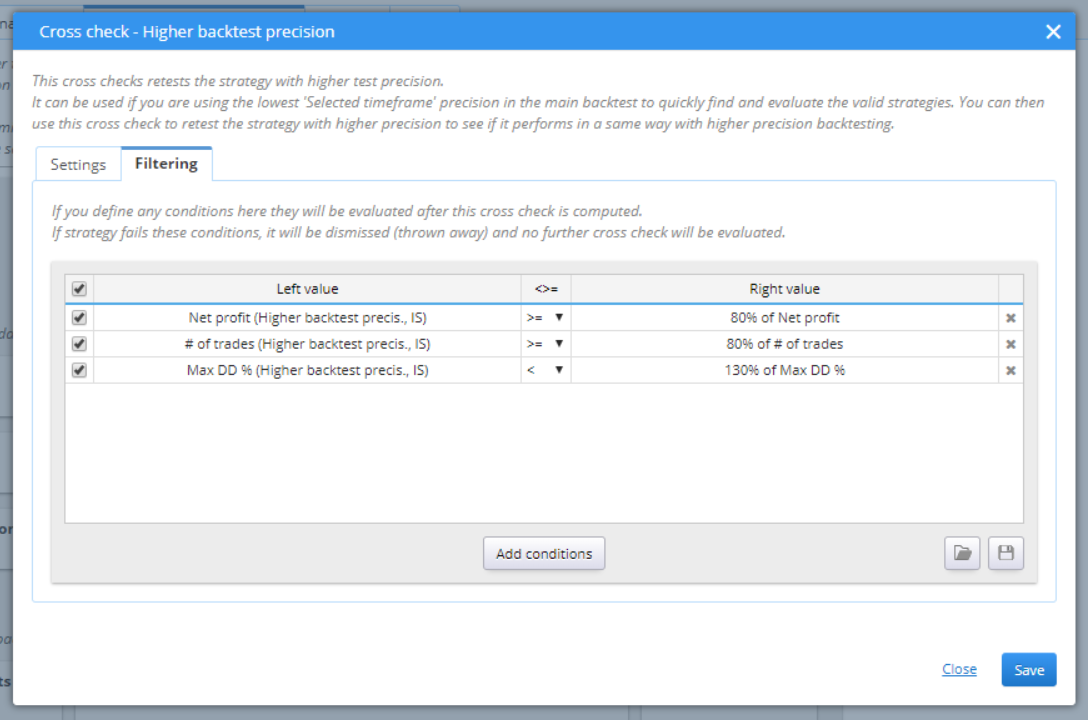
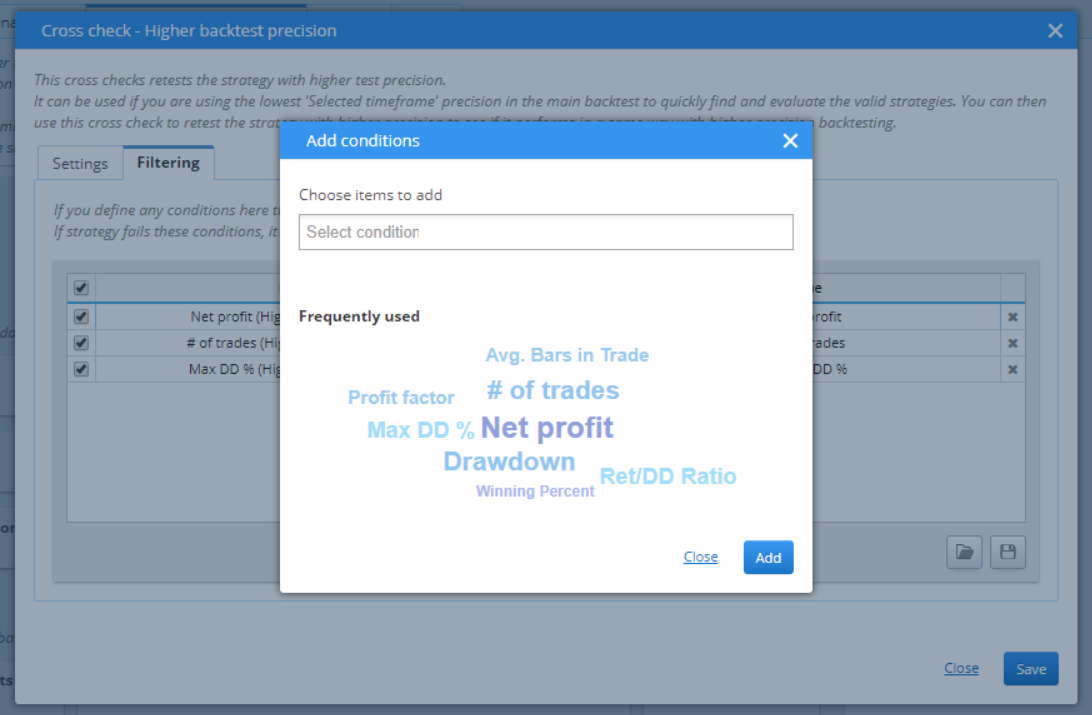
You can change the filtering options for the backtest, add or remove conditions. Setting the filters right is important because the criteria will determine the “Passed” candidates.
You can edit every part of the condition by double-clicking it.
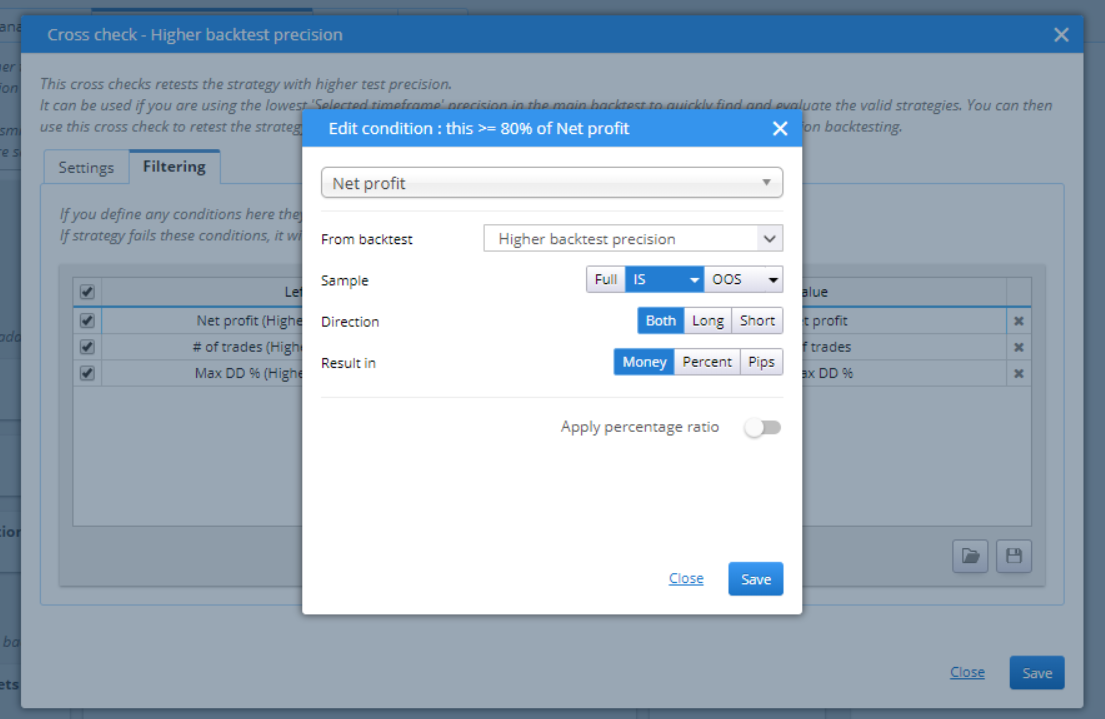
Add a filtering condition by clicking the Add conditions button.
» BASIC / WHAT IF SIMULATIONS
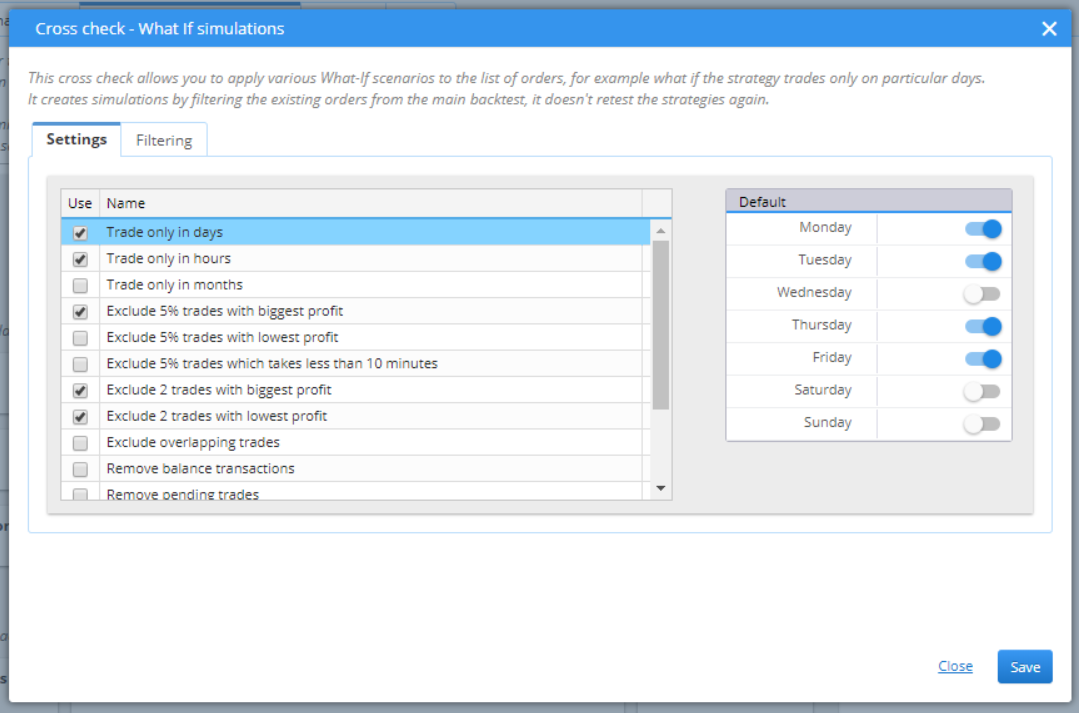
This test is simple and effective. It simulates what would happen to the performance of the strategy if some change is applied to the original configurations. It is very fast, because it does not make any additional tests, instead it works with the data from the databank.
You can set the conditions that you want to test by selecting them from the list and configuring the desired values in the right part of the pop-up window.
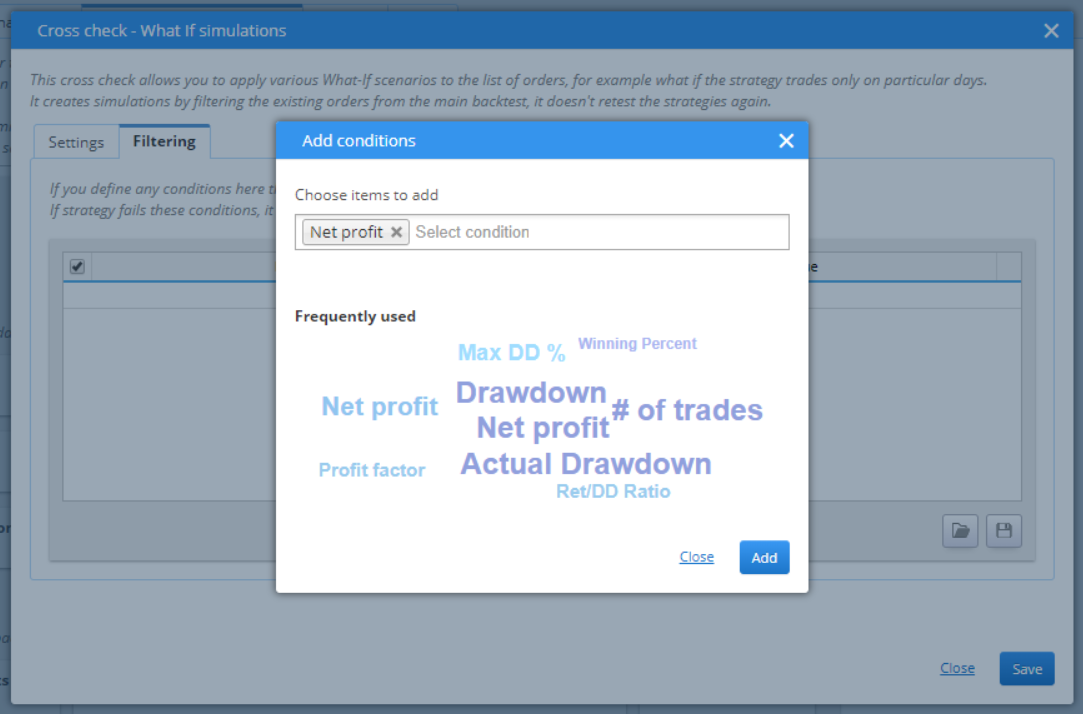
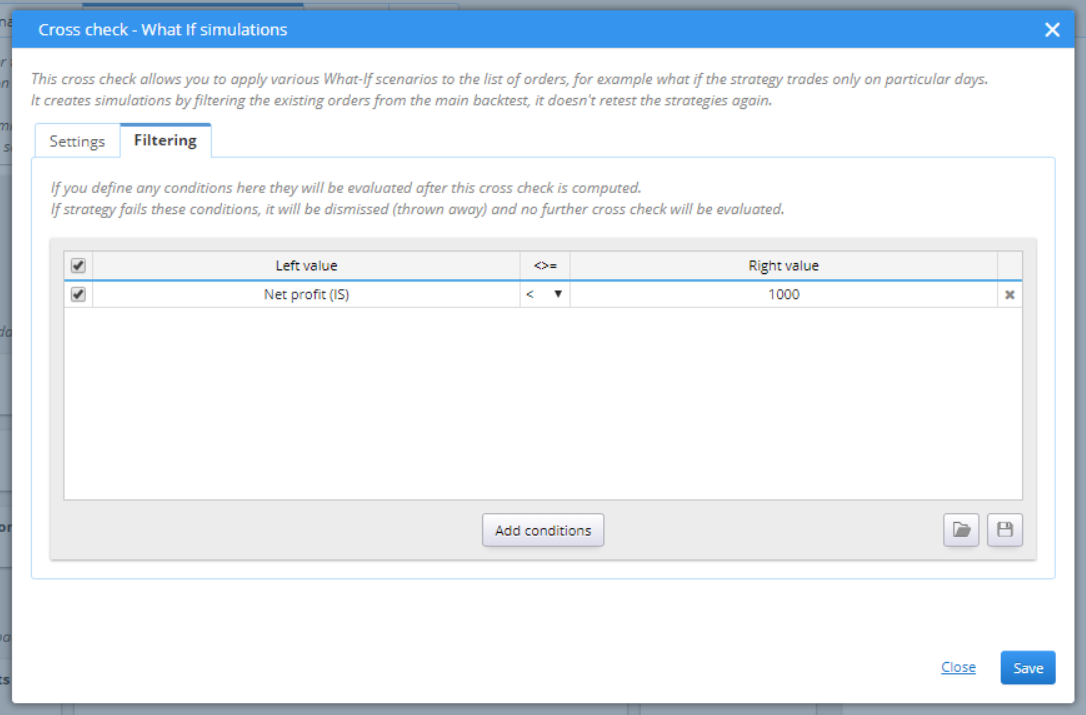
You can then add filtering conditions. They check the results of each candidate and if it does not meet the criteria, it is dismissed and is not tested further.
» BASIC / MONTE CARLO TRADES MANIPULATION
This cross check runs many simulations in which it manipulates the existing trades. It does not perform backtests, but uses the data from the databank. This makes this cross check very fast.
You can choose the settings from this menu. There are two types of tests.
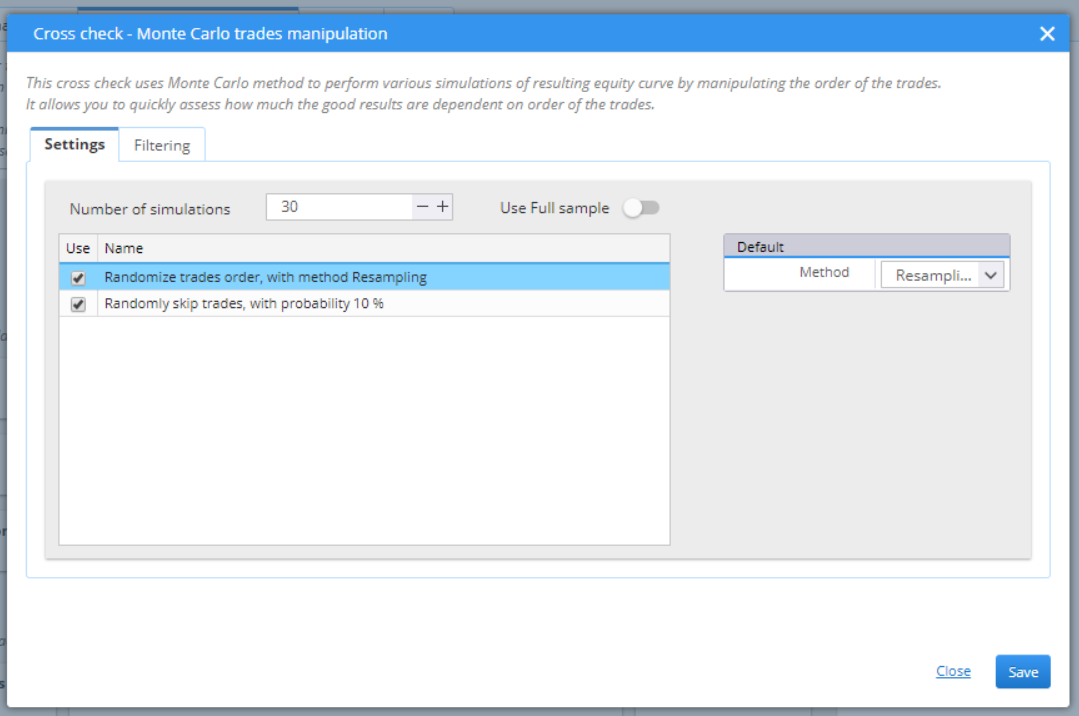
› The first randomizes, or shuffles, the trades order. This does not change the Net Profit, rather gives a different perspective to the possible drawdown of the strategy.
› The second option is to randomly skip trades. You can customize the probability rate. This test can measure the sensibility of each strategy to missing some trades. A robust enough strategy should hold steady results even when a few trades are skipped.
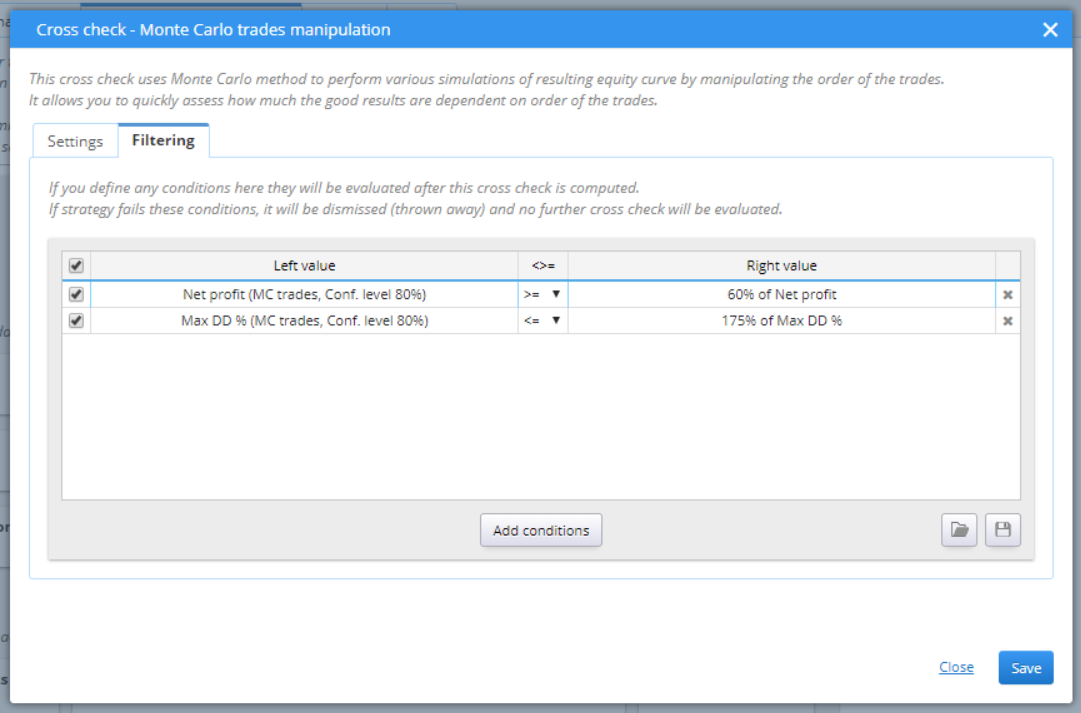
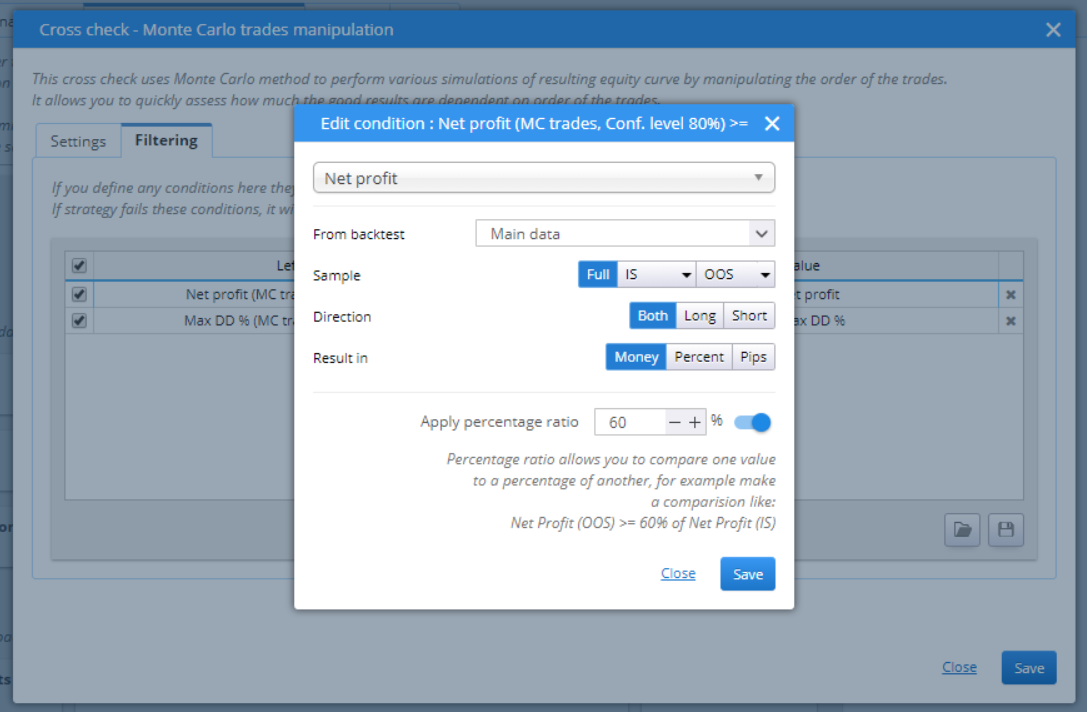
You can set filters that would evaluate the results of the strategy, once it passes the Monte Carlo trades manipulation. This way candidates that fail to meet the criteria will be dropped out of further testing.
» STANDART / BACKTESTS ON ADDITIONAL MARKETS
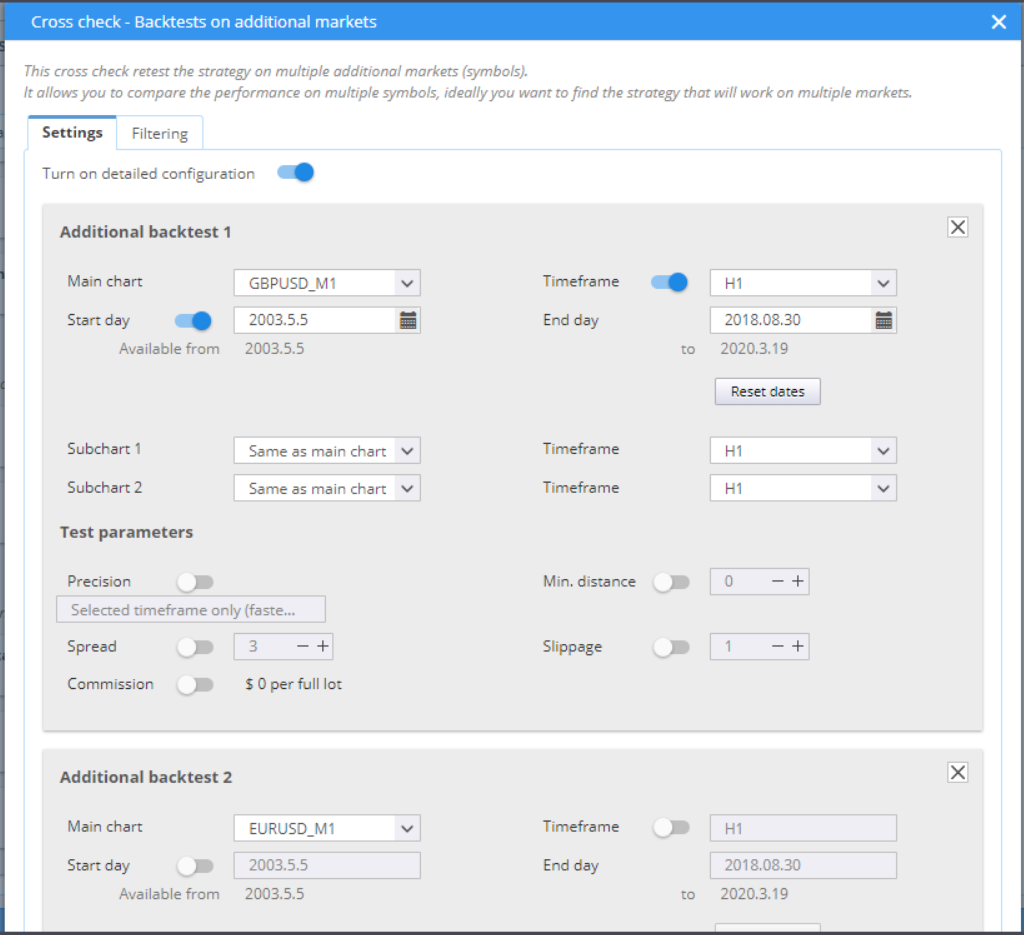
This cross check retests the strategy on a different symbol market or a different timeframe. As each market has its own specifics, this test should be considered successful when the strategy manages to keep some profitability.

You can configure the settings for your test using the settings tab.
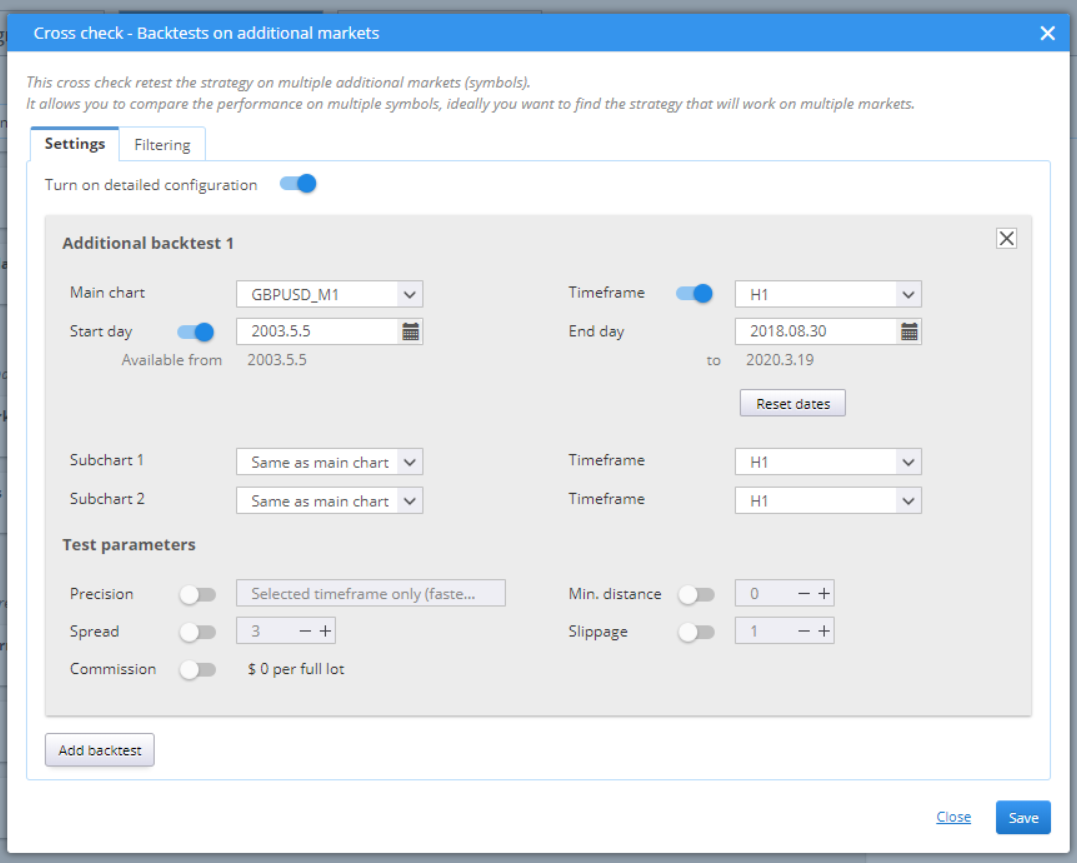
You can add additional backtests by clicking the Add backtest on the bottom / left of the pop-up window.
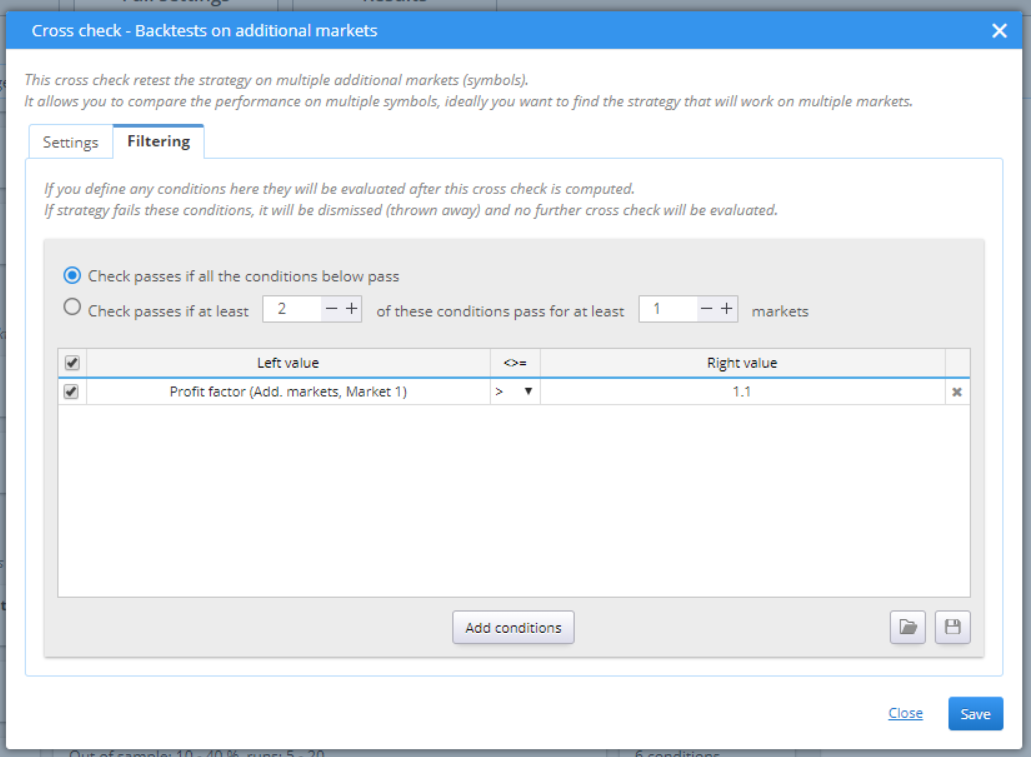
As with the other tests, Filtering provides the option to evaluate the results and stop the strategies that failed from being tested further.
» STANDART / MONTE CARLO RETEST METHODS
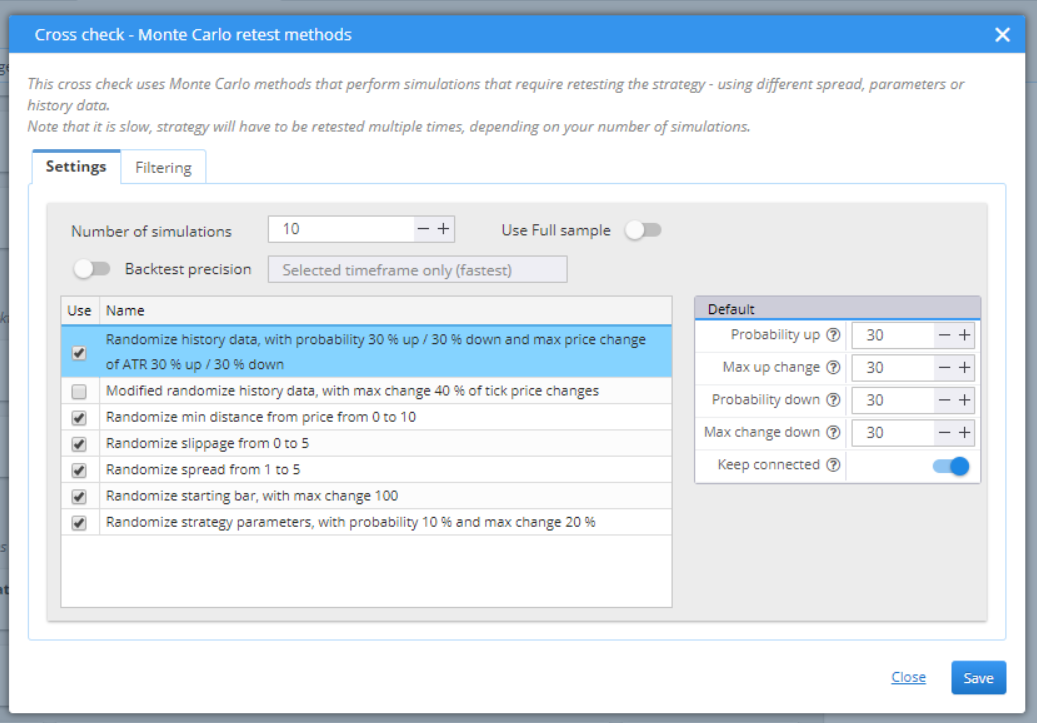
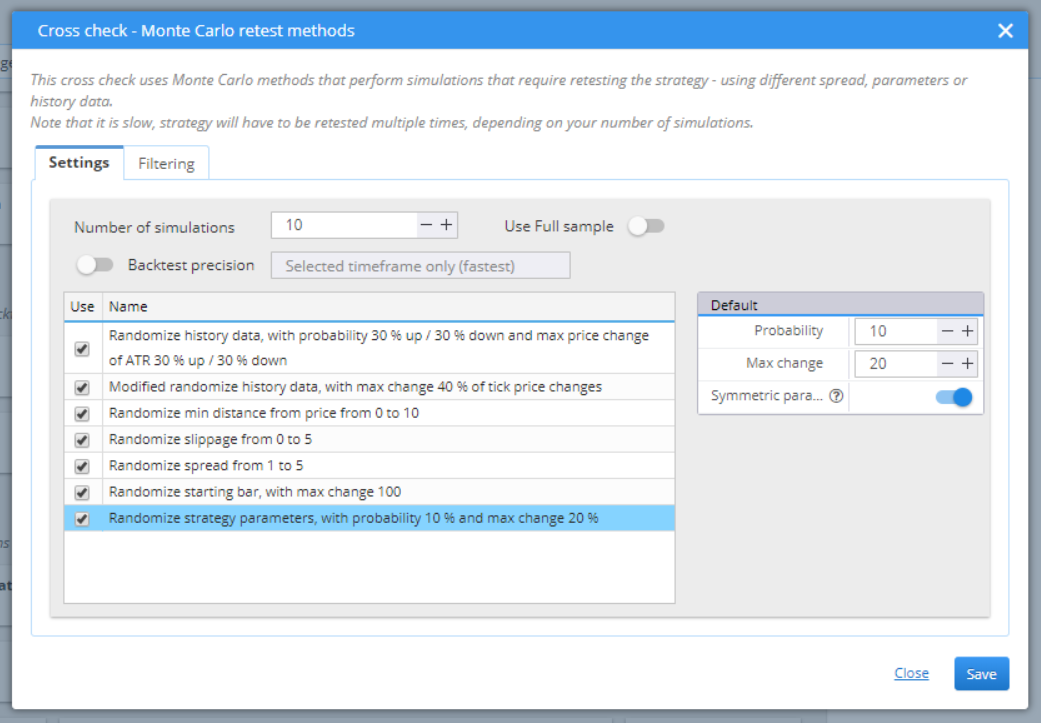
This method backtests the strategies by changing different settings from the building process, like trading parameters, spread, slippage or history data. This is a thorough, time-consuming cross check. You can choose to activate several types of Monte Carlo tests in Settings.
Randomize history data is a very useful tool. It can detect whether the strategy is too over-fitted to the data it’s been developed on. You can set probability rates for up and down change in price, as well as the maximum change, calculated as a percentage of the ATR value. The Keep connected option saves the original distance (if any) between successive bars.
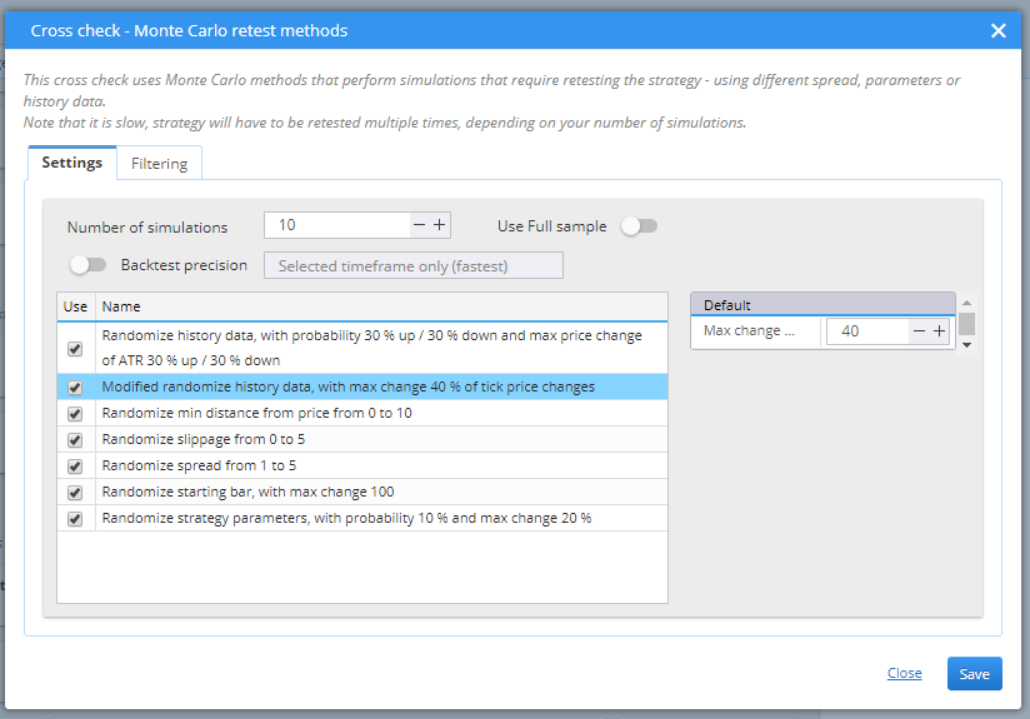
Modified randomized history data simulates changes within the bars. The probability for this is configurable.
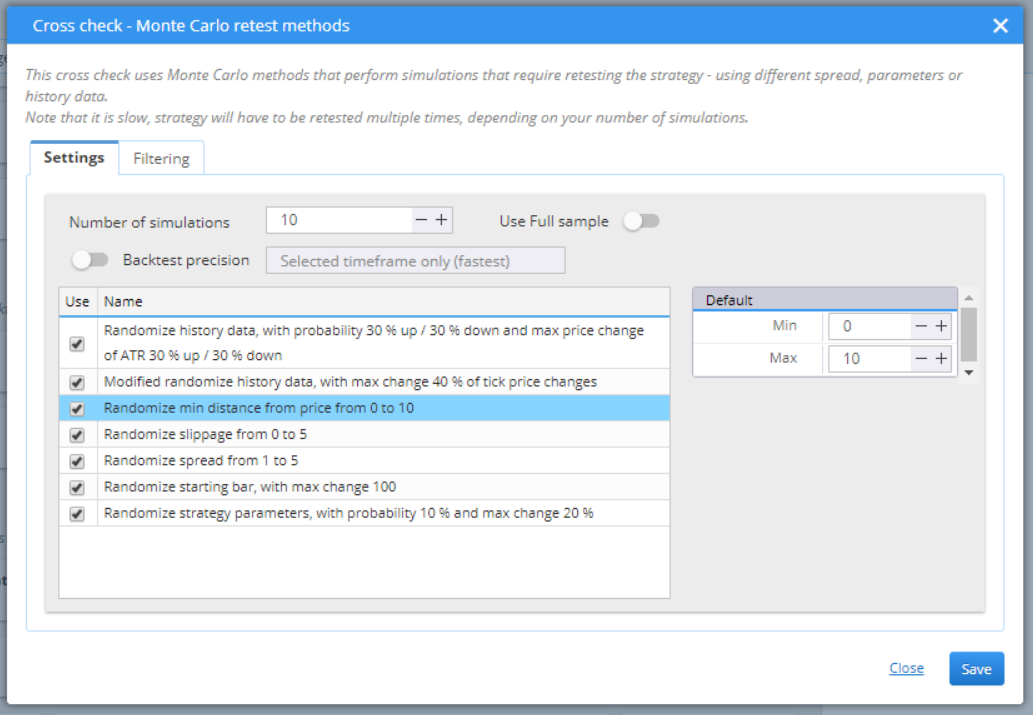
Randomize min distance from price would change the minimum permitted distance from the current price, where the pending orders can be placed. You can set a lower and upper limit to the range in the box to the right.
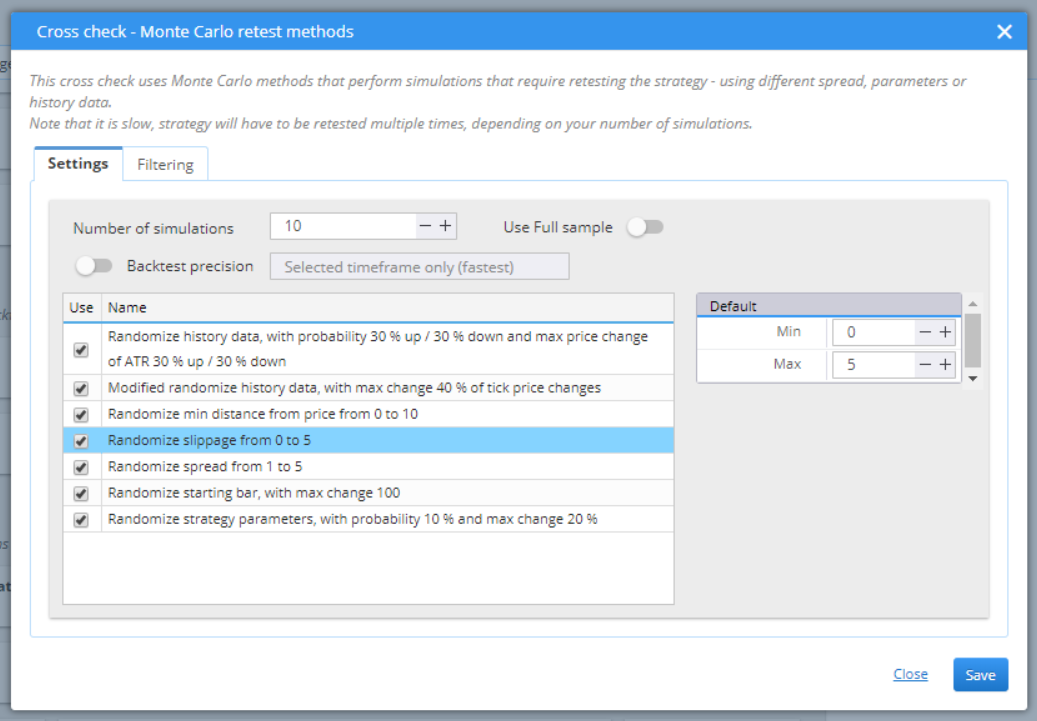
Randomize slippage would change the slippage of the positions. You can set minimum and maximum value.
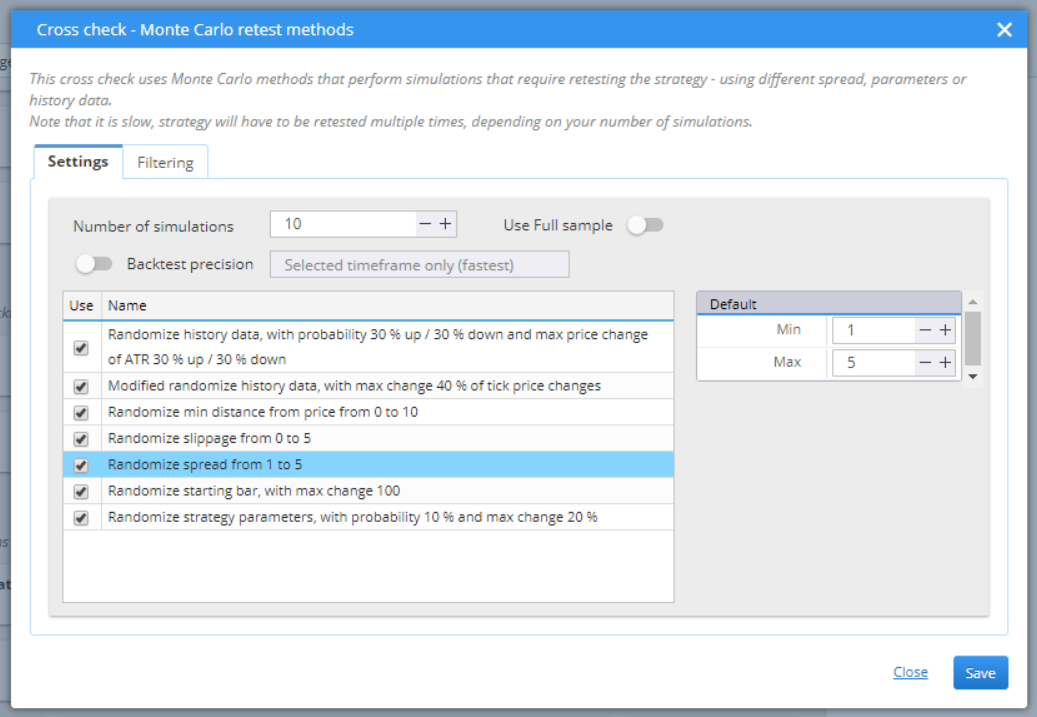
Randomize spread changes the value of the spread and tests the different variations. You can set the range in the box to the right.
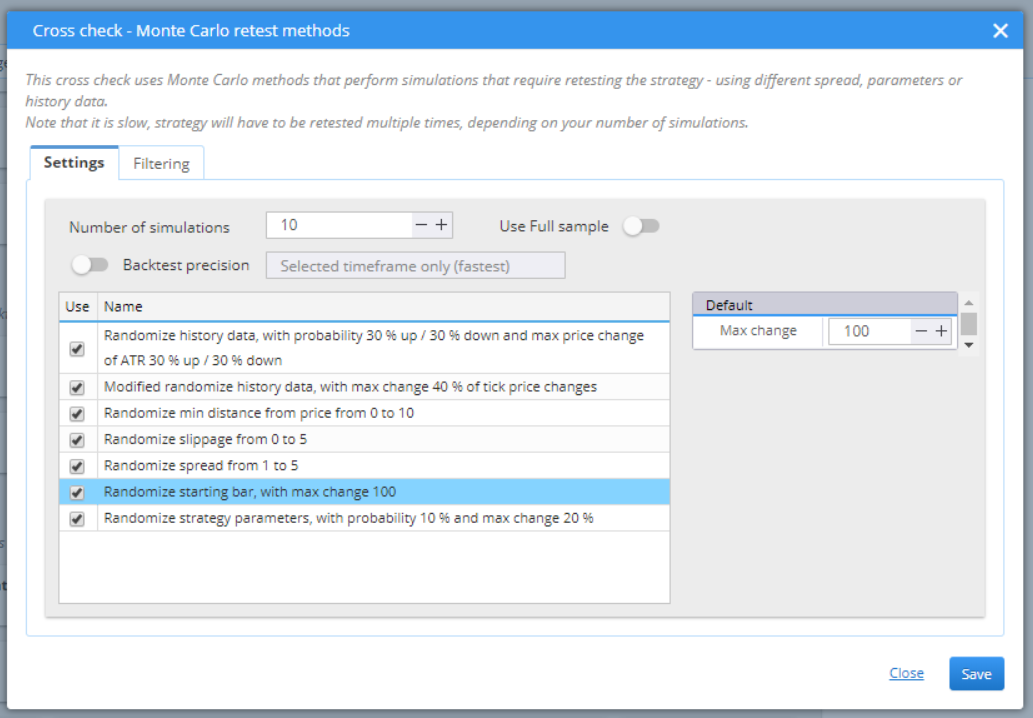
Randomize starting bar shifts the starting point of the strategy. A robust strategy should not be influenced by this change. The value in the right field is the maximum number of bars that the backtest can move the start to.
Randomize strategy parameters makes small changes to things like period of an indicator, or a constant (number) that is used in the different comparisons. The right box contains two fields. Probability is a percentage representation of how likely it is for the parameter to change. Max change is the limit (again in percent) of change for the parameter’s value.
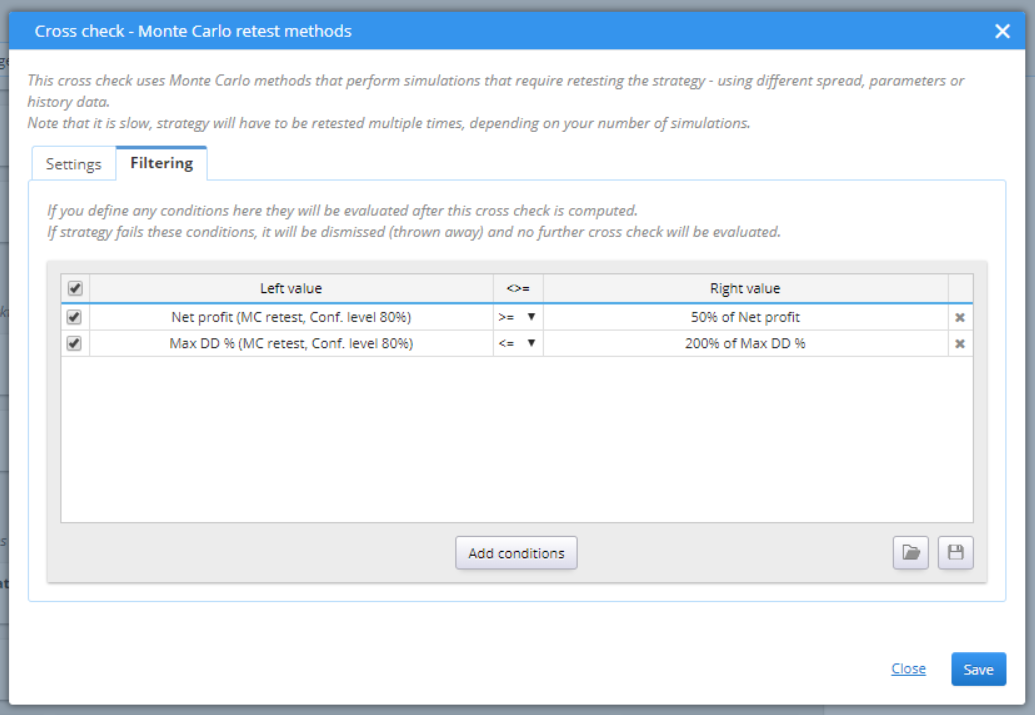
You should set filtering rules to define the “pass” conditions of the test. Failing to meet the filters would also stop the strategies from further testing.
» EXTENSIVE / OPT.PROFILE/SYS.PARAM.PERMUTATION
The extensive cross-checks are the slowest tests. They aim to optimize the strategy by searching for the optimal solution. You can choose to create an Optimization Profile by activating the first cross-check in the Extensive section.

Setting it is easy – you just need to choose the maximum tests that you want the system to run.
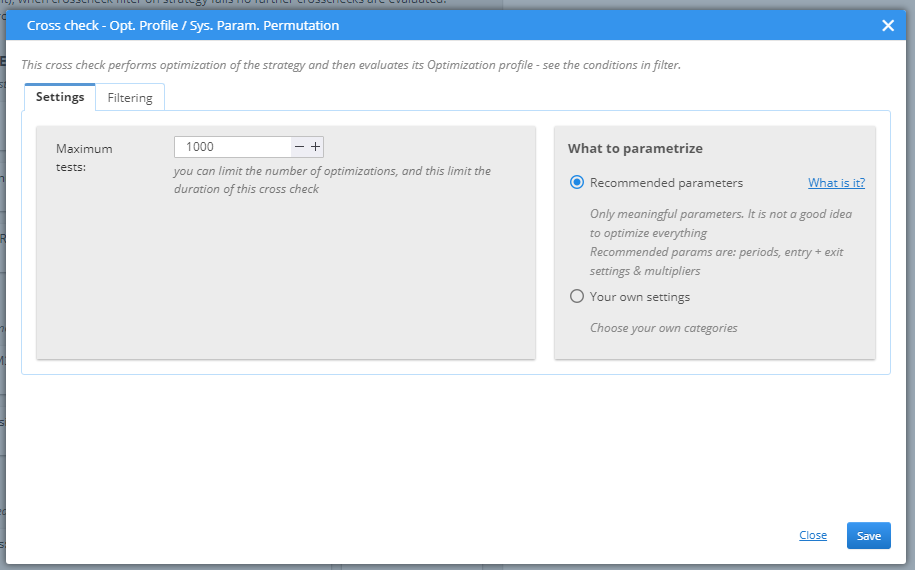
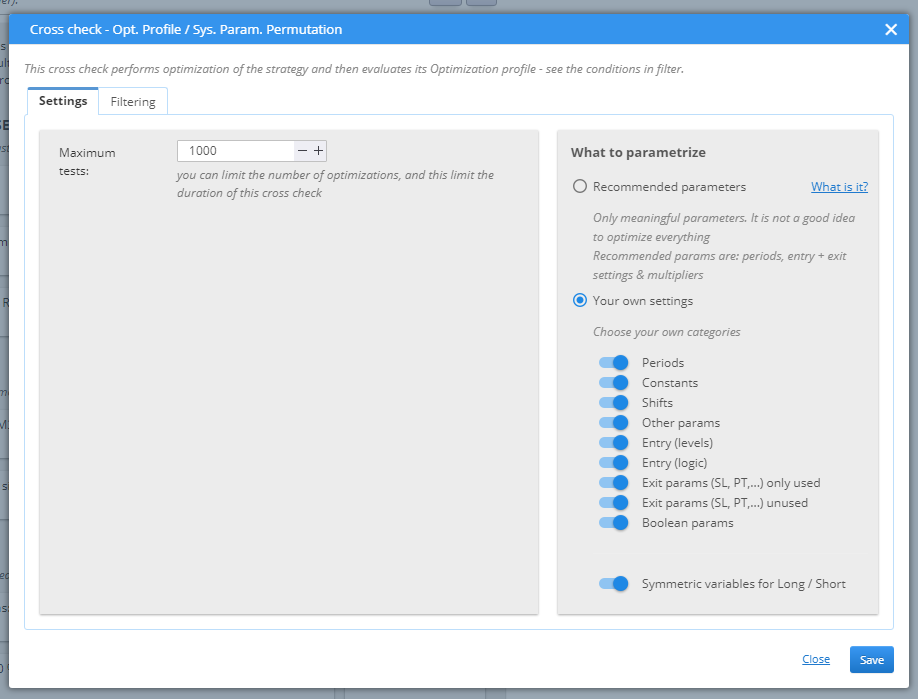
What to parametrize has two options. You can either use the default setting, which optimizes periods, entry and exit rules, and multipliers, or make your custom settings.
Then you have to set the filtering conditions. They all need to be passed for a strategy to be considered successful.
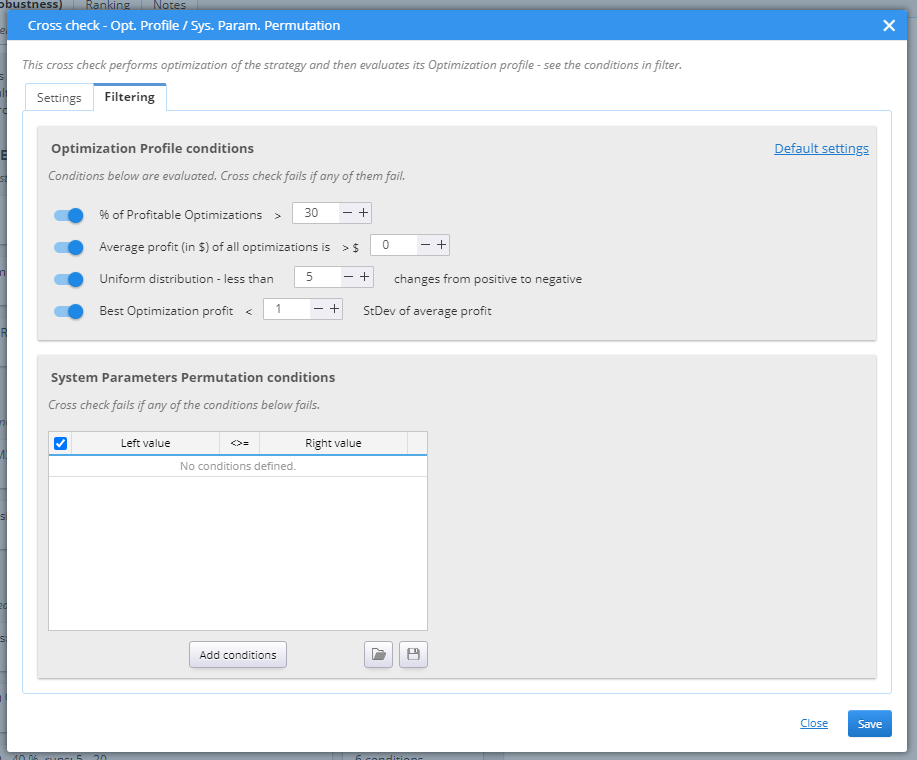
› % of Profitable Optimization – a robust strategy would have a fairly good rate of profitable optimization runs, as it should perform well under a wide range of small changes to its parameters.
› Average Profit of all optimization – the logic here is similar to the previous point. A robust strategy should keep its profit stable, despite the changes applied to it in the optimization runs.
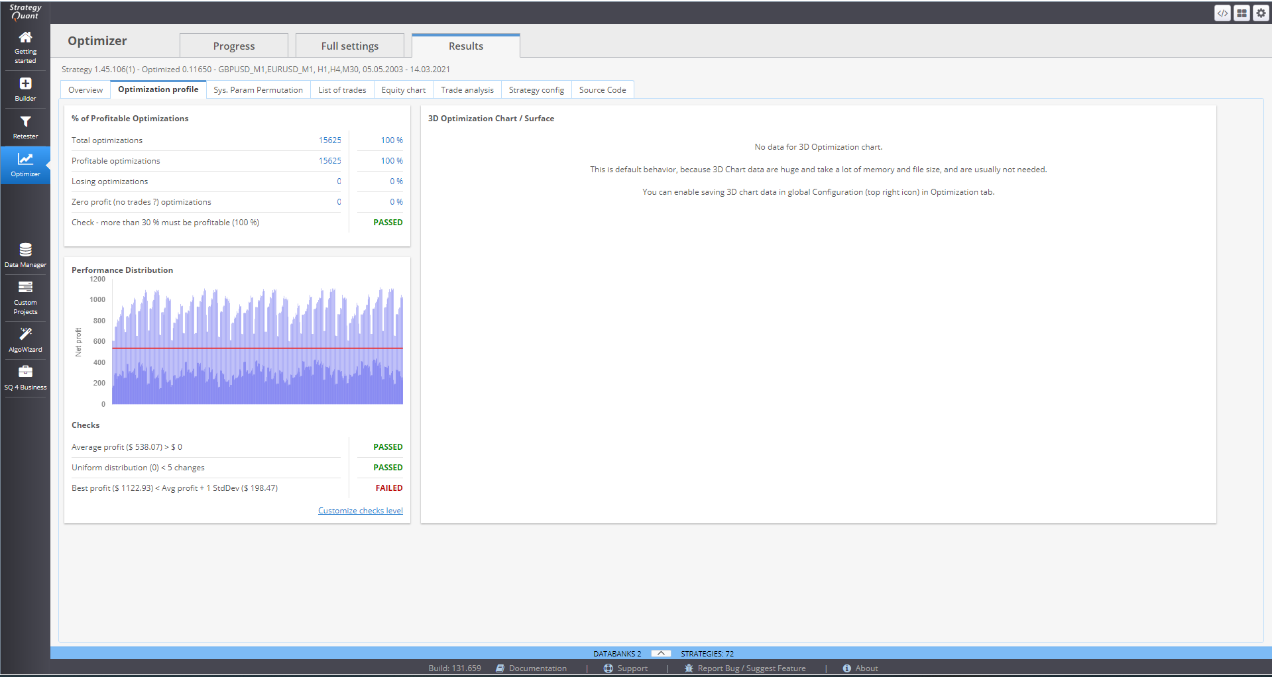
› Uniform distribution sets an upper limit to the number of positive-to-negative or negative-to-positive turns. A sound candidate should perform smoothly and not give diametrically different results with each optimization.
› Best Optimization profit – the best candidate should not be too much better than the average performance. This once again refers to the smooth performing, optimal strategy that is considered to be the best solution. This is an important thing to consider, because a strategy with sporadic excellent performance could distort the overall optimization results.
When this cross check is switched on, a tab in Optimizer / Results appears, displaying the optimization profile of the tested strategy.
System Parameters Permutation is a method for analyzing strategies that are developed through data mining, as is the case with StrategyQuant. It postulates that in order to accurately evaluate a candidate we need to test every possible parameter combination. This complete optimization provides median values for the parameters that are considered a realistic estimation of the strategy performance.
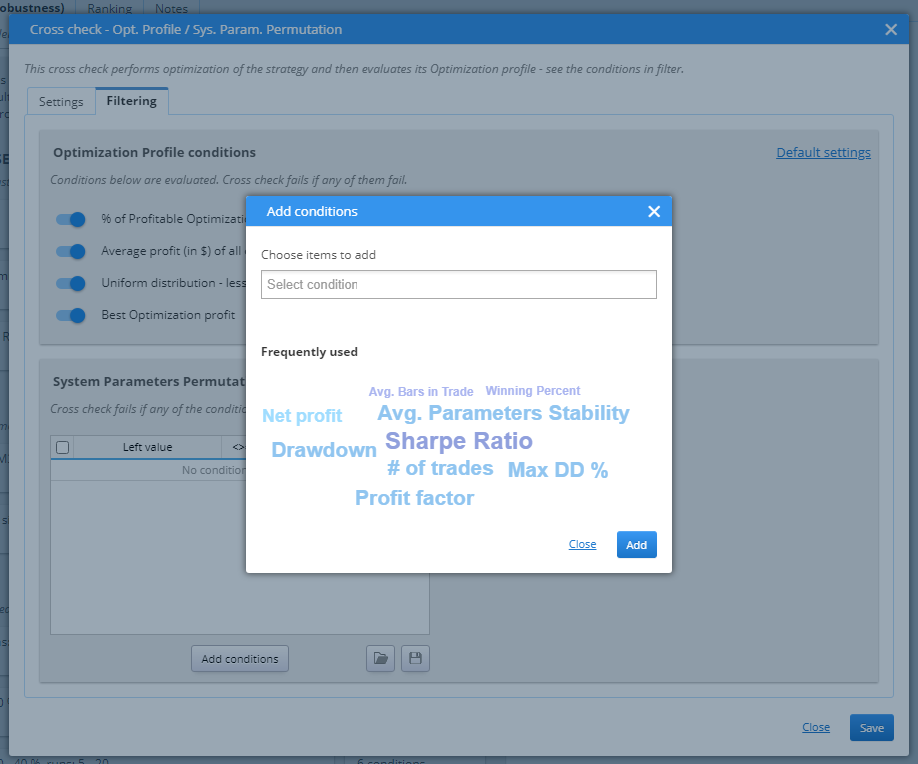
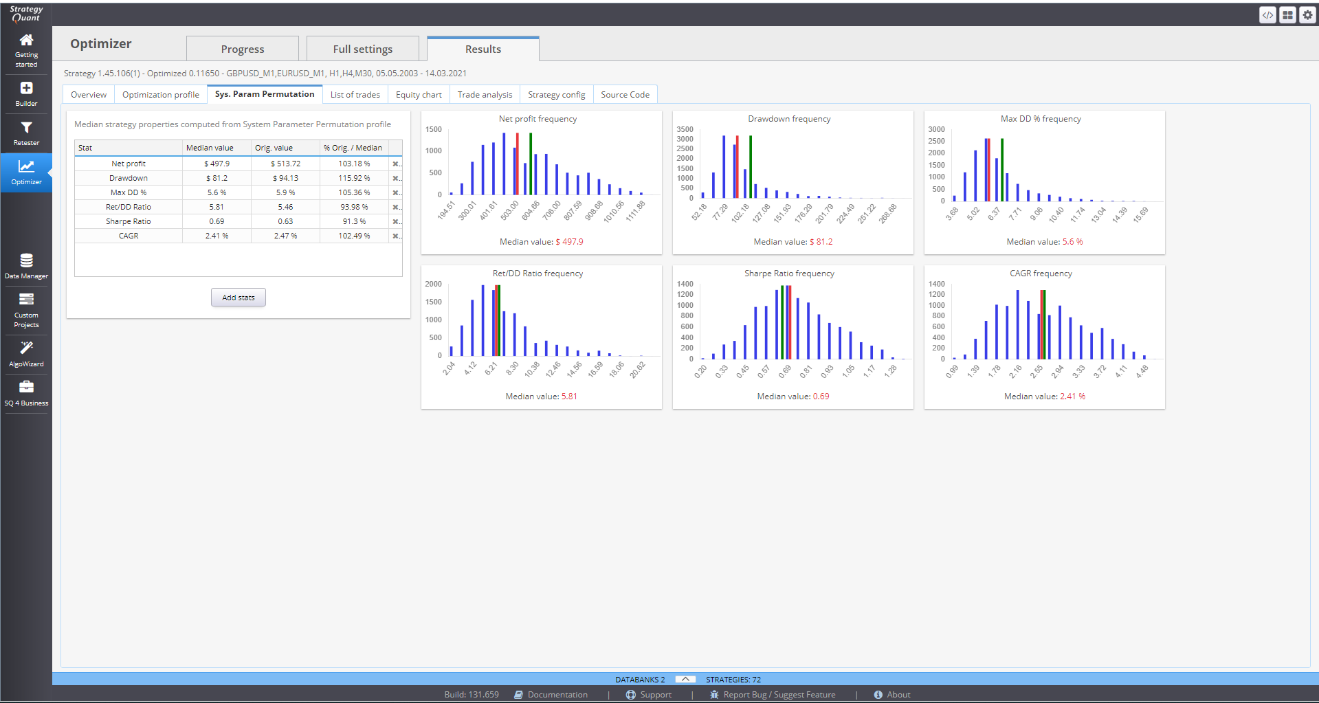
Giving the fact that sometimes the possible combinations that can be tested is huge, Retester performs a milder version of SPP method. Still, the computed median values can be useful. Once acquired, they can be utilized in the different filters.
When this cross check is active, a new tab appears in Optimizer / Results, called Sys.Param.Permutation. It provides detailed graphical representations of the test results.
» EXTENSIVE / WALK-FORWARD OPTIMIZATION
Walk-Forward optimization divides the history data into pieces. Each piece has two segments – In sample (IS) and Out of sample (OOS). The first segment is where the actual optimization is done by testing each parameter in a given range, to find the optimal performance of the strategy. Once optimized, the strategy is then tested on the OOS segment. This is history data unknown to the strategy and to Retester. It does not include the OOS period into the optimization process. This ensures an objective evaluation of the strategy performance.

Once the optimization of the first piece of history data is completed (IS + OOS parts), the algorithm takes the next step and performs the same tests on the next piece. To keep the optimization going further, it includes part of the IS segment and the whole OOS segment from the previous step to do the IS analysis of the current piece of history data.
From Settings you need to choose the Walk-Forward type, or in other words, what history data will be used for the testing.
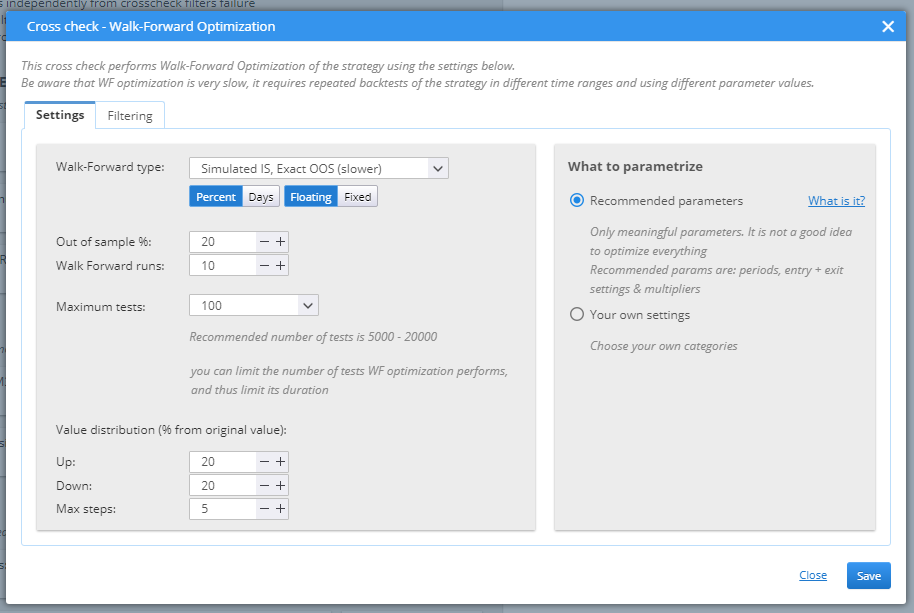
› Simulated IS, Simulated OOS is the fastest test. It uses simulated data for both the In Sample part and the Out of Sample part of the optimization process.
› The second option is Simulated IS, Exact OOS. This is beneficial for the results of the candidates, because it tests the optimized solution onto real history data.
› The most precise option, and the most time-consuming is the Exact IS, Exact OOS type. It needs real data for both tests.
You need to set the OOS part (as a percentage or in days), the number of runs or optimization steps, that the process will perform and the maximum number of tests. Value distribution defines boundaries to the variation range of the tested parameters (how much higher or lower values can be used in the tests), as well as the maximum step. What to parametrize can use default setting and optimize parameters like periods, entry and exit rules, and multipliers. Or you can choose to define your own settings.
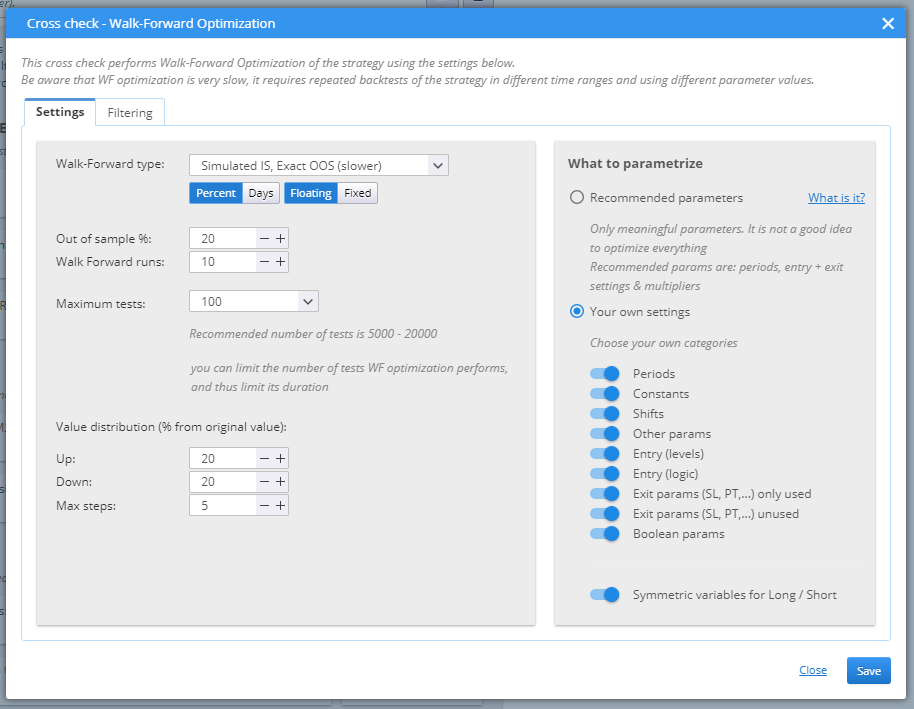
Tab Filtering is the place to set the success conditions.
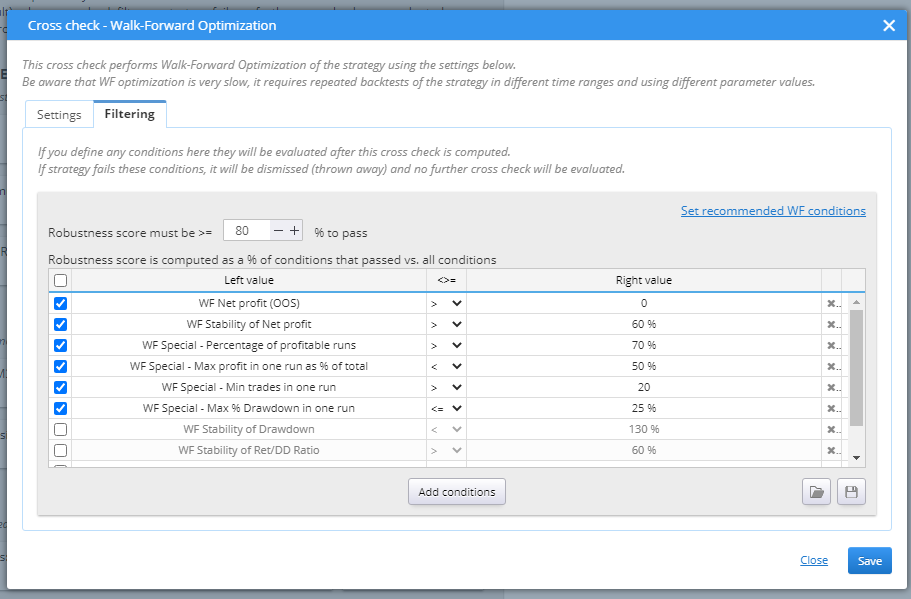
The rules are configurable. You can double-click on an item to open an edit pop-up window and change it to a desired state. You can also add or remove conditions.
» EXTENSIVE / WALK-FORWARD MATRIX
Walk-Forward Matrix takes the process one step further. It performs multiple Walk-Forward optimizations and tests different In Sample / Out of Sample configurations. By doing this it calibrates the effectiveness of the strategy in simulated real-trading environment. Because financial markets are a volatile, ever changing place, even the best strategy can lose its edge if it does not follow the dynamics of the market.
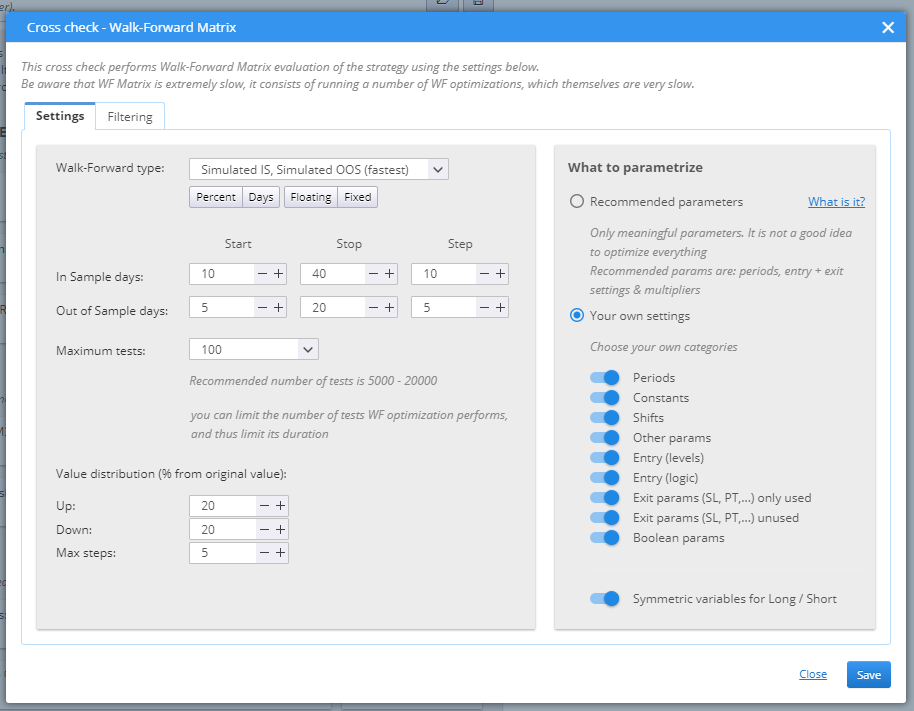
The parameters for the WF Matrix are defined in Settings.
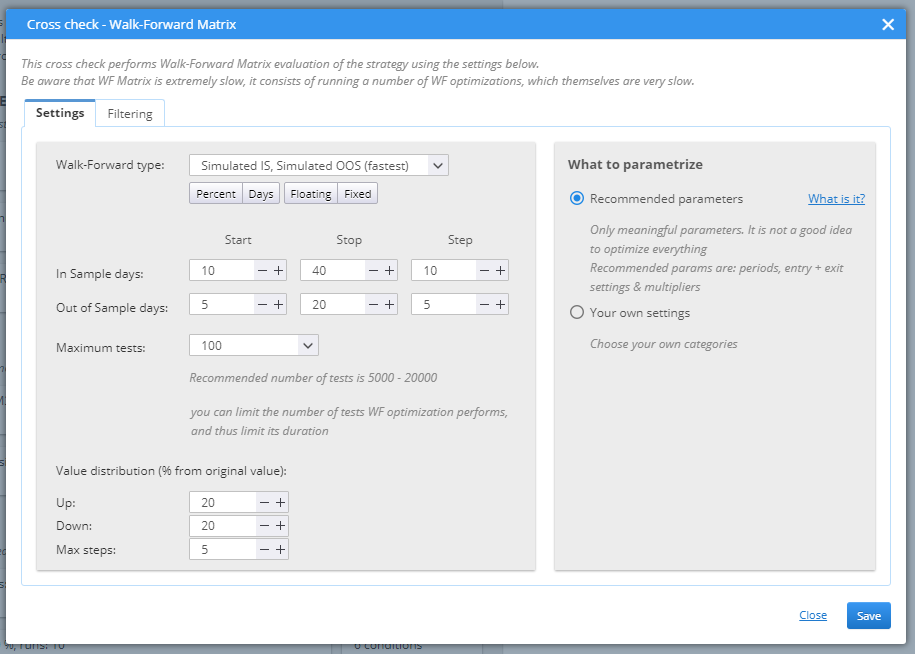
There are three options to choose from in Walk-Forward type.
› Simulated IS, Simulated OOS is the fastest test. It uses simulated data for both the In Sample part and the Out of Sample part of the optimization process.
› The second option is Simulated IS, Exact OOS. This is beneficial for the results of the candidates, because it tests the optimized solution onto real history data.
› The most precise option, and the most time-consuming is the Exact IS, Exact OOS type. It needs real data for both tests.
You need to set the IS and OOS parts (as a percentage or in days) and the maximum number of tests. Value distribution defines boundaries to the variation range of the tested parameters (how much higher or lower values can be used in the tests), as well as the maximum step. What to parametrize can use default setting and optimize parameters like periods, entry and exit rules, and multipliers. Or you can choose to define your own settings.
Tab Filtering is the place to set the success conditions.
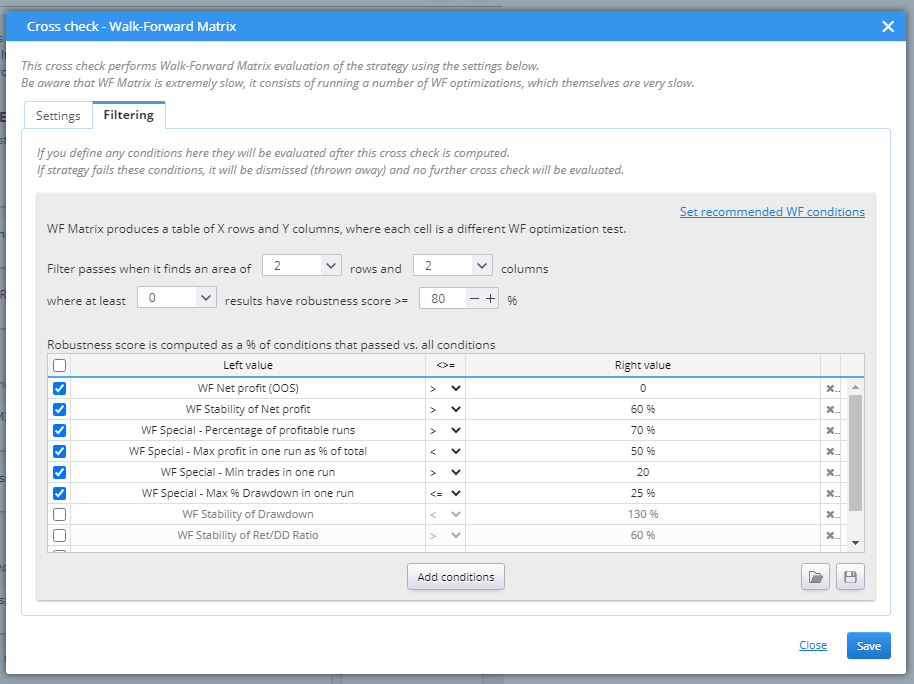
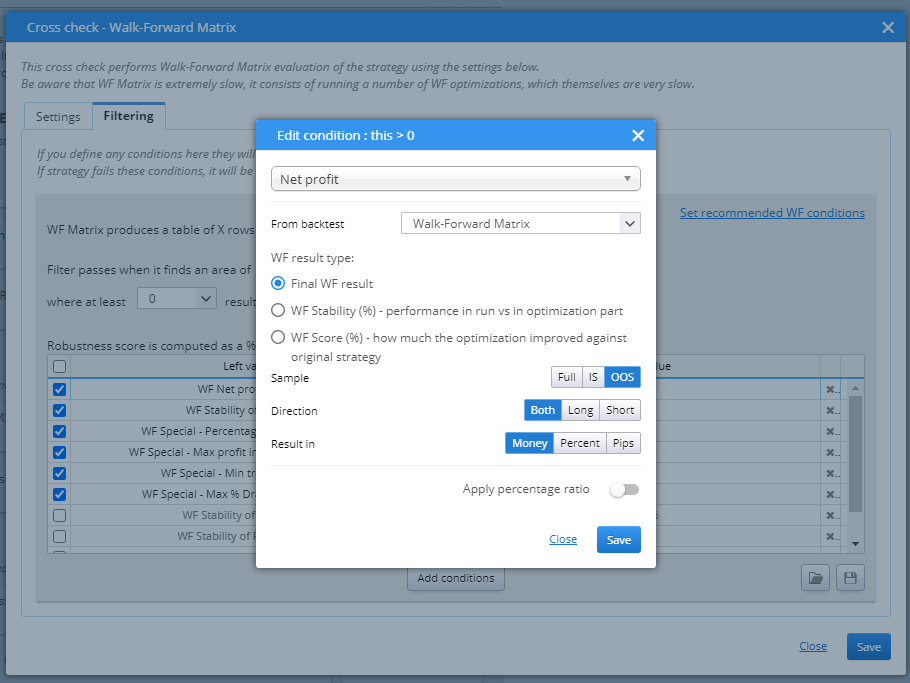
The rules are configurable. You can double-click on an item to open an edit pop-up window and change it to a desired state.
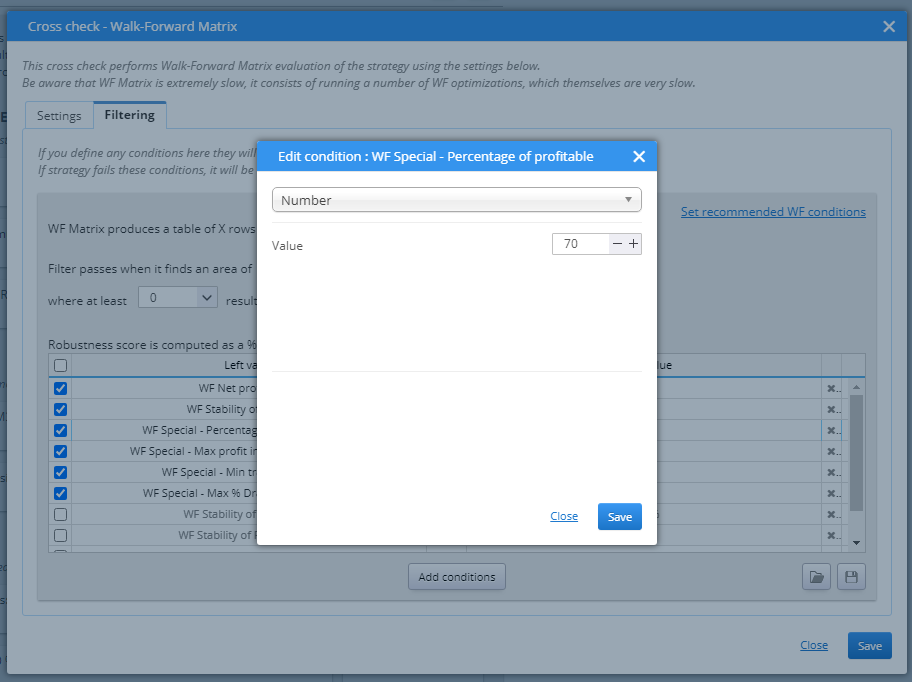
You can easily change the value by double-clicking on the value field.
RANKINGS & FILTERING
After the strategies are backtested they are given a rank, depending on their results. This rank is a number between 0 and 1, and is a representation of the strategy’s fitness (quality), or how well it performed, according to the predefined criteria.
This section is where you define how the strategies are rated. You can also configure filters to further evaluate the strategies before they are saved in the databank.
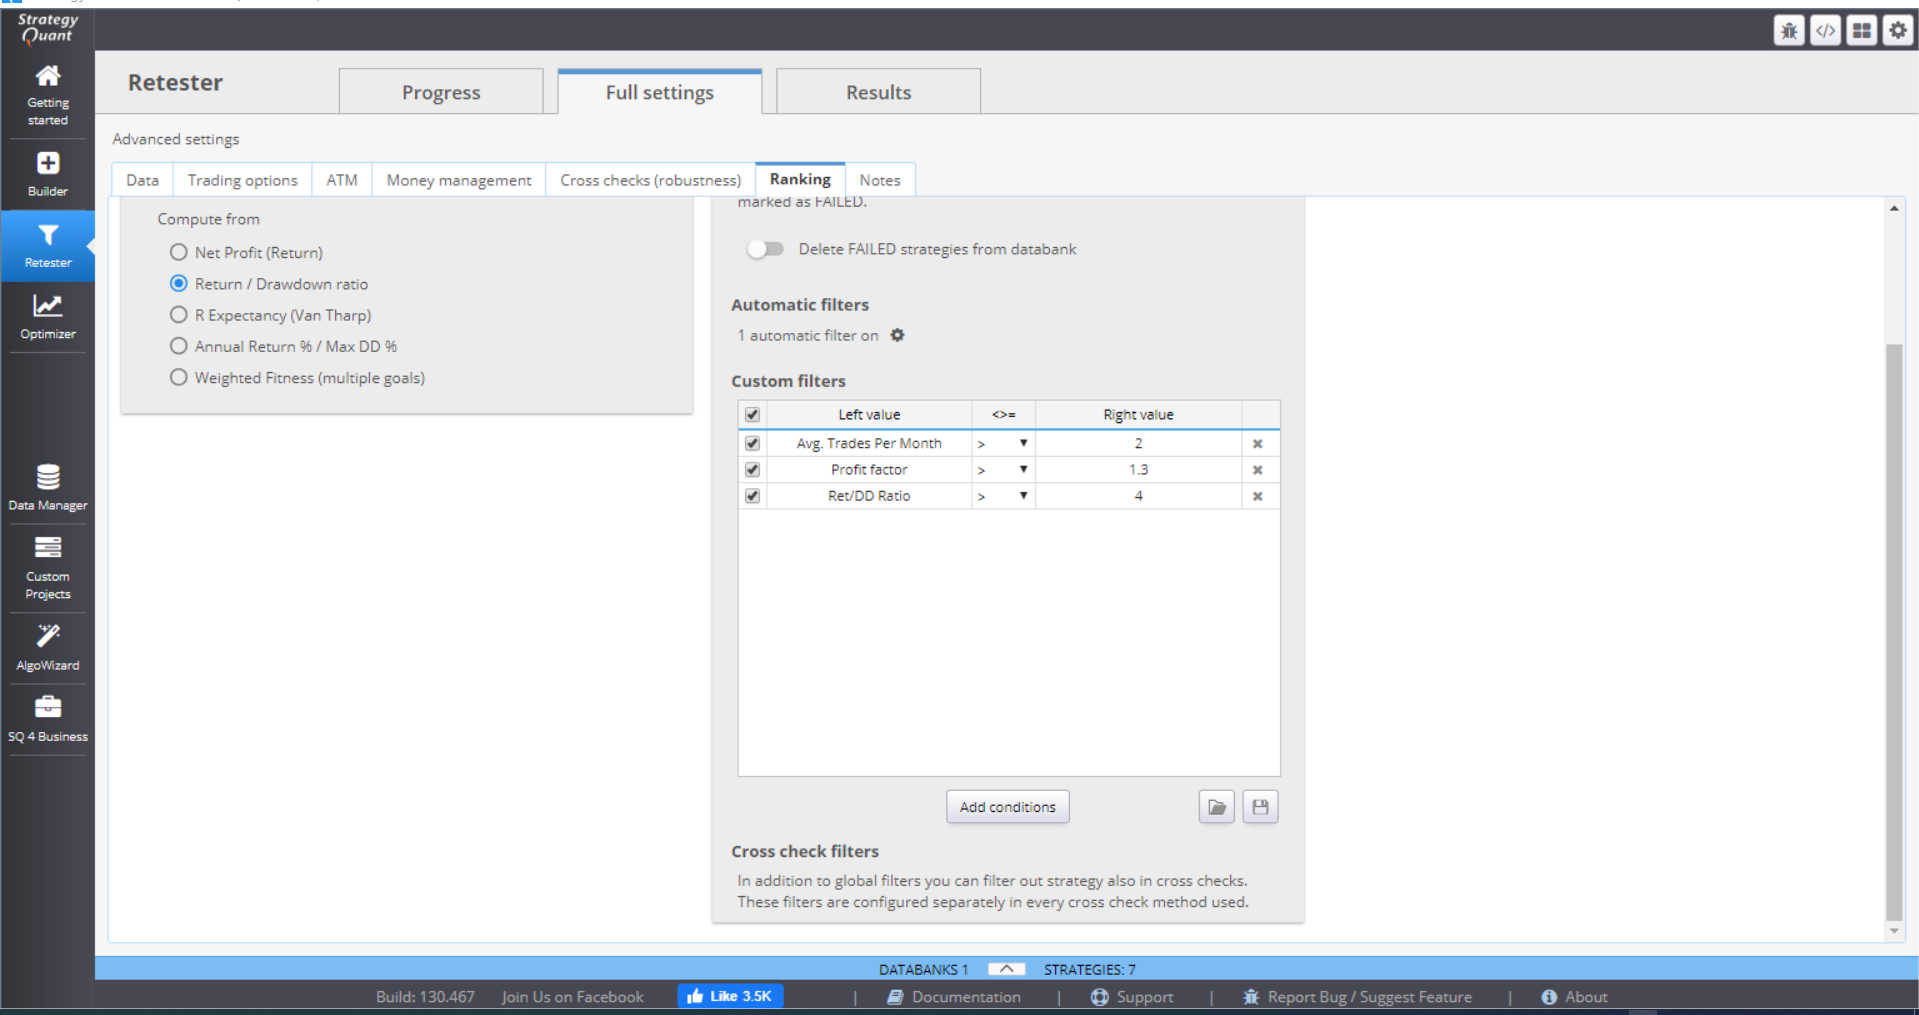
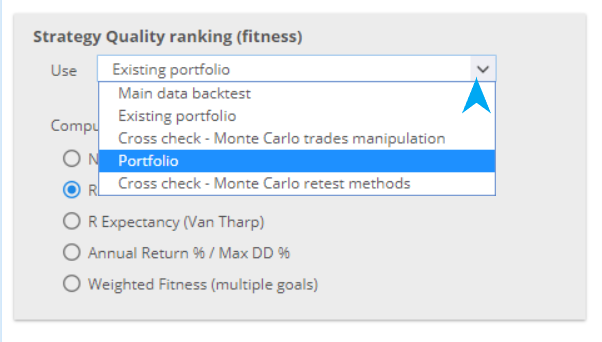
You can choose the data from which to compute the fitness.
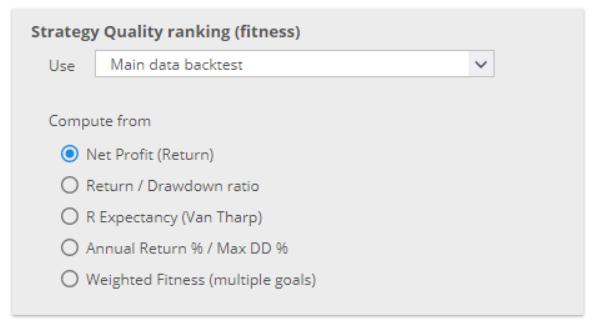
Then you can select the criteria to use for the ranking. You may choose one of the default computations.
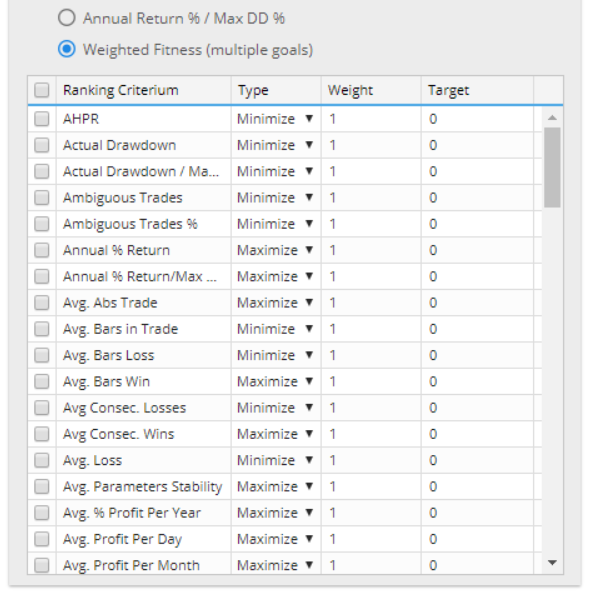
Or, you can configure custom rules. The options here are flexible and you can set the rules in a variety of ways.
The filtering section of the menu is where you set the conditions that determine whether the strategy Passed or Failed retesting.
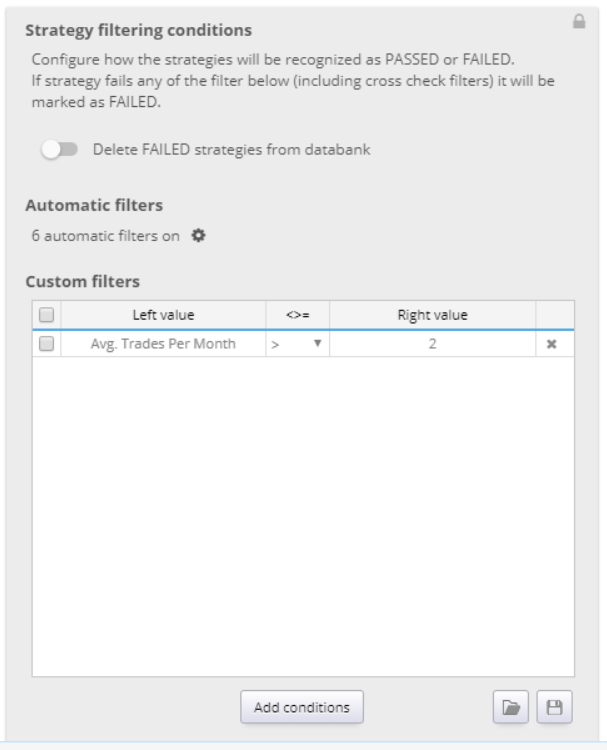
The default settings for Retester is to not delete failed strategies. If you prefer to delete them, you can switch on this option here.
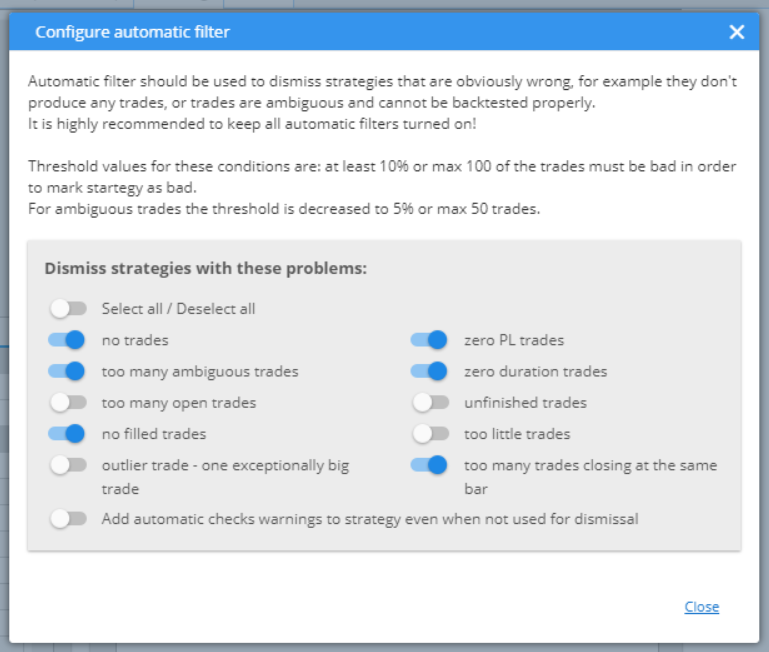
The Automatic filters are some of the most frequently used and logical ones. The settings will be imported from Builder when you transfer the strategies for retesting, but you can still manage them further, if you choose to.
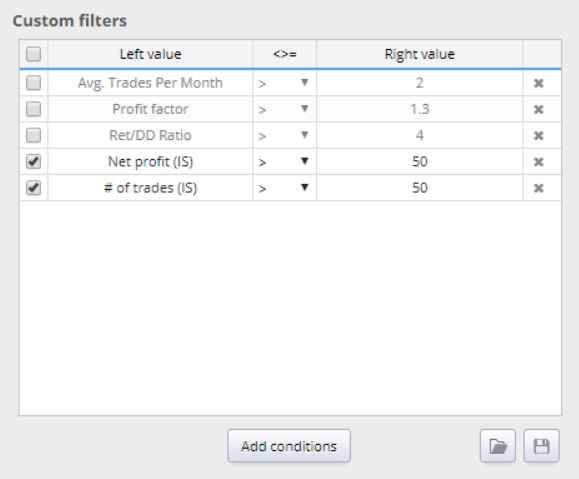
You can also configure custom filters. You can add or remove conditions, or change their settings.
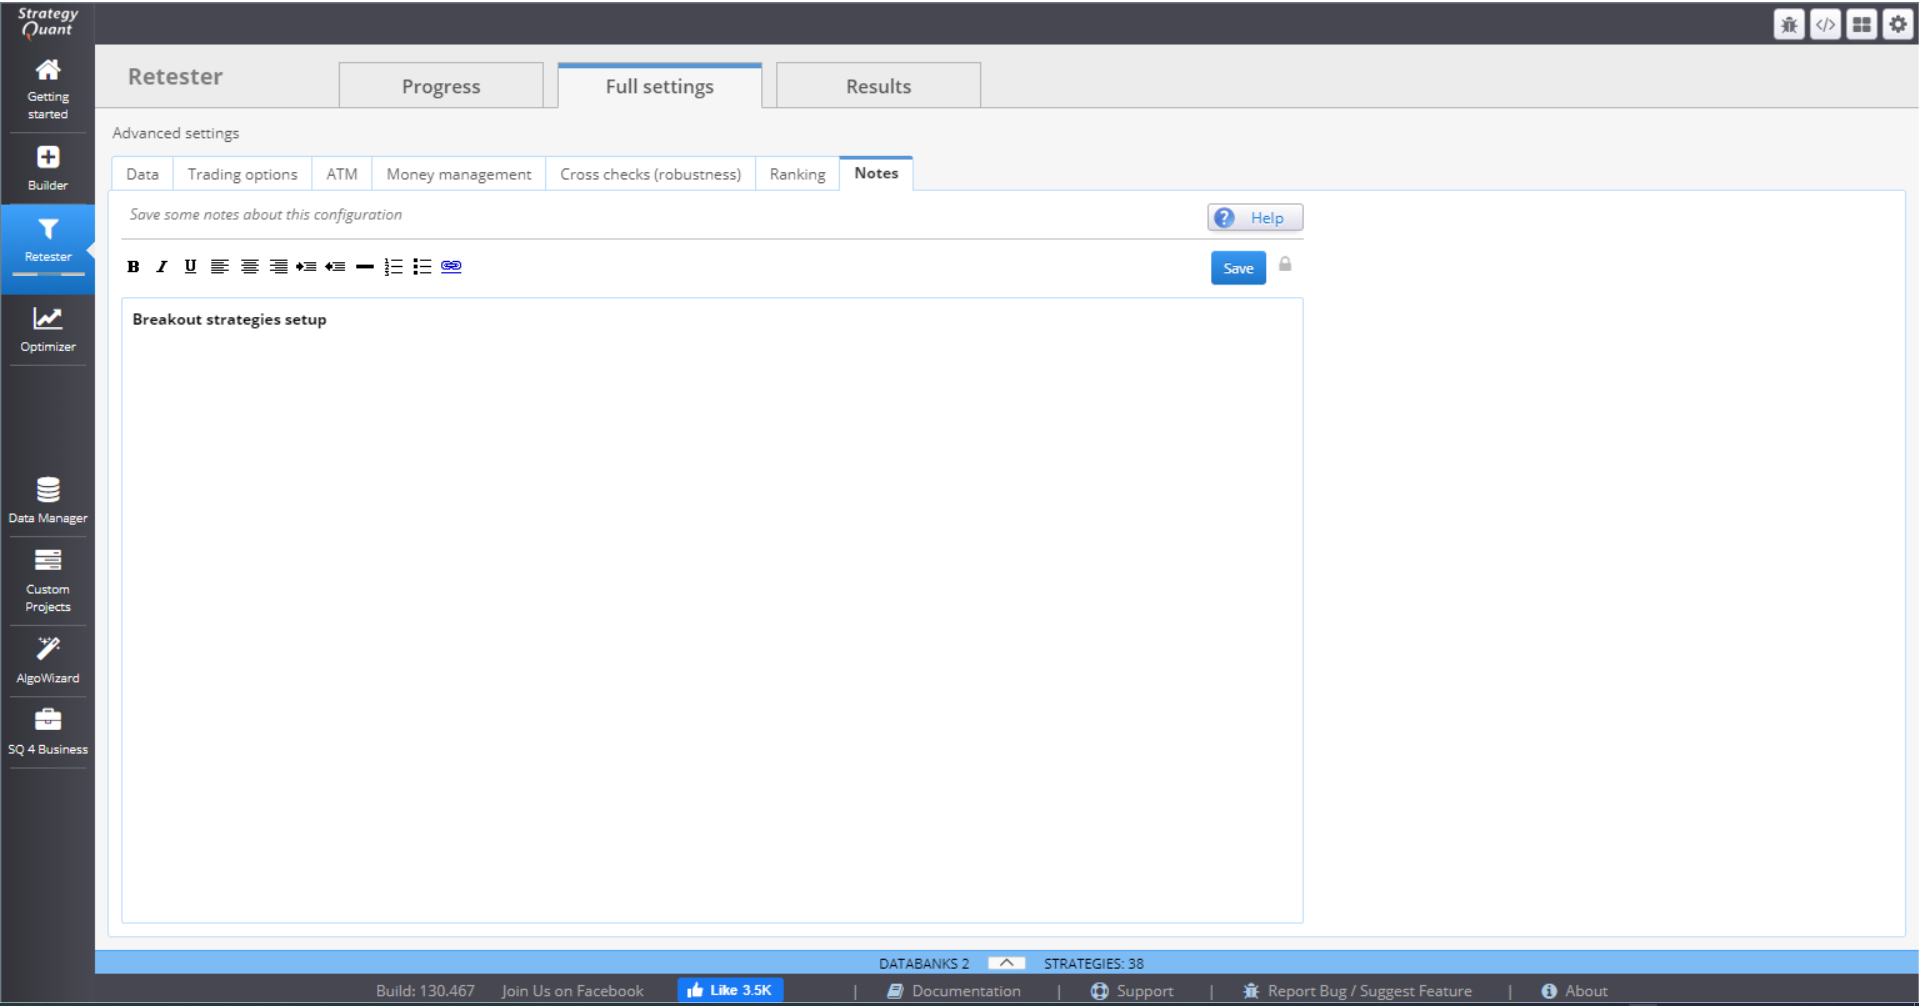
NOTES
You can write down your notes here. They will be saved together with all configuration settings of your project.
RESULTS
The Results tab contains a variety of charts and tables that present the details and statistics of the generated strategies.
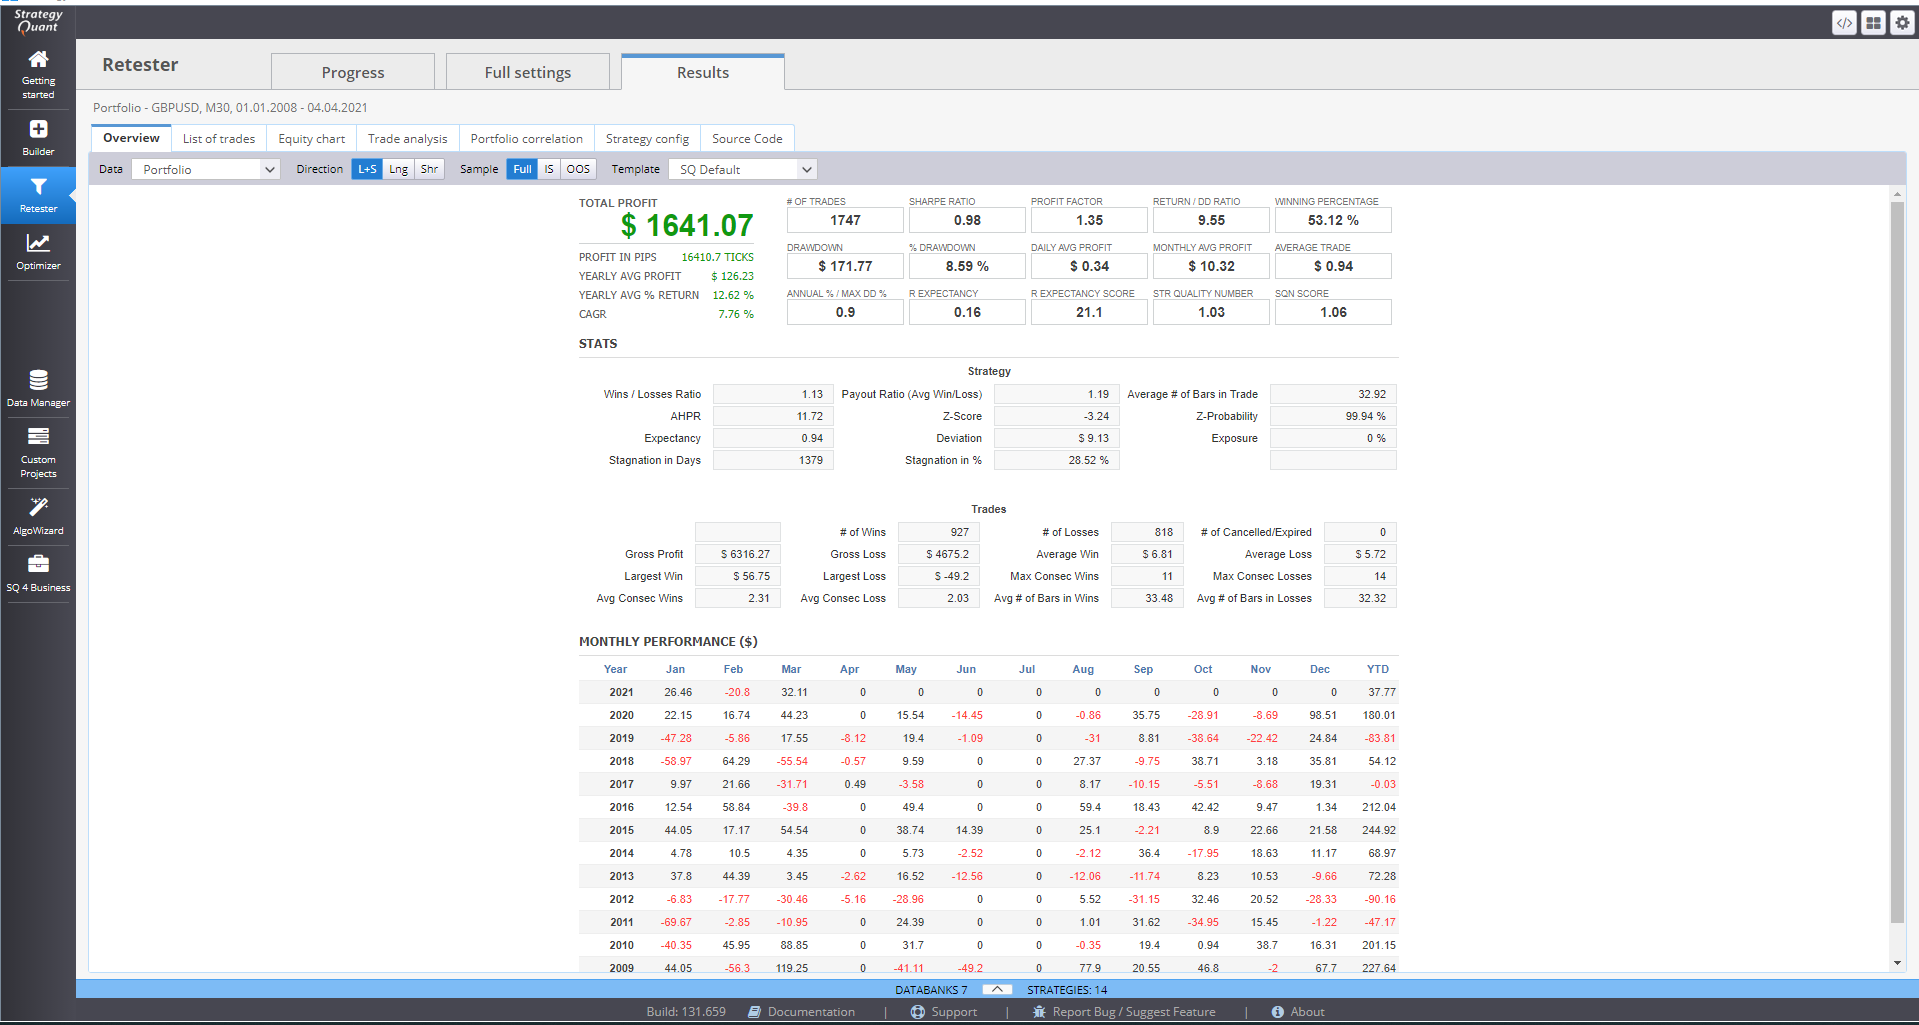
Overview tab shows detailed statistics and the monthly performance of a strategy.
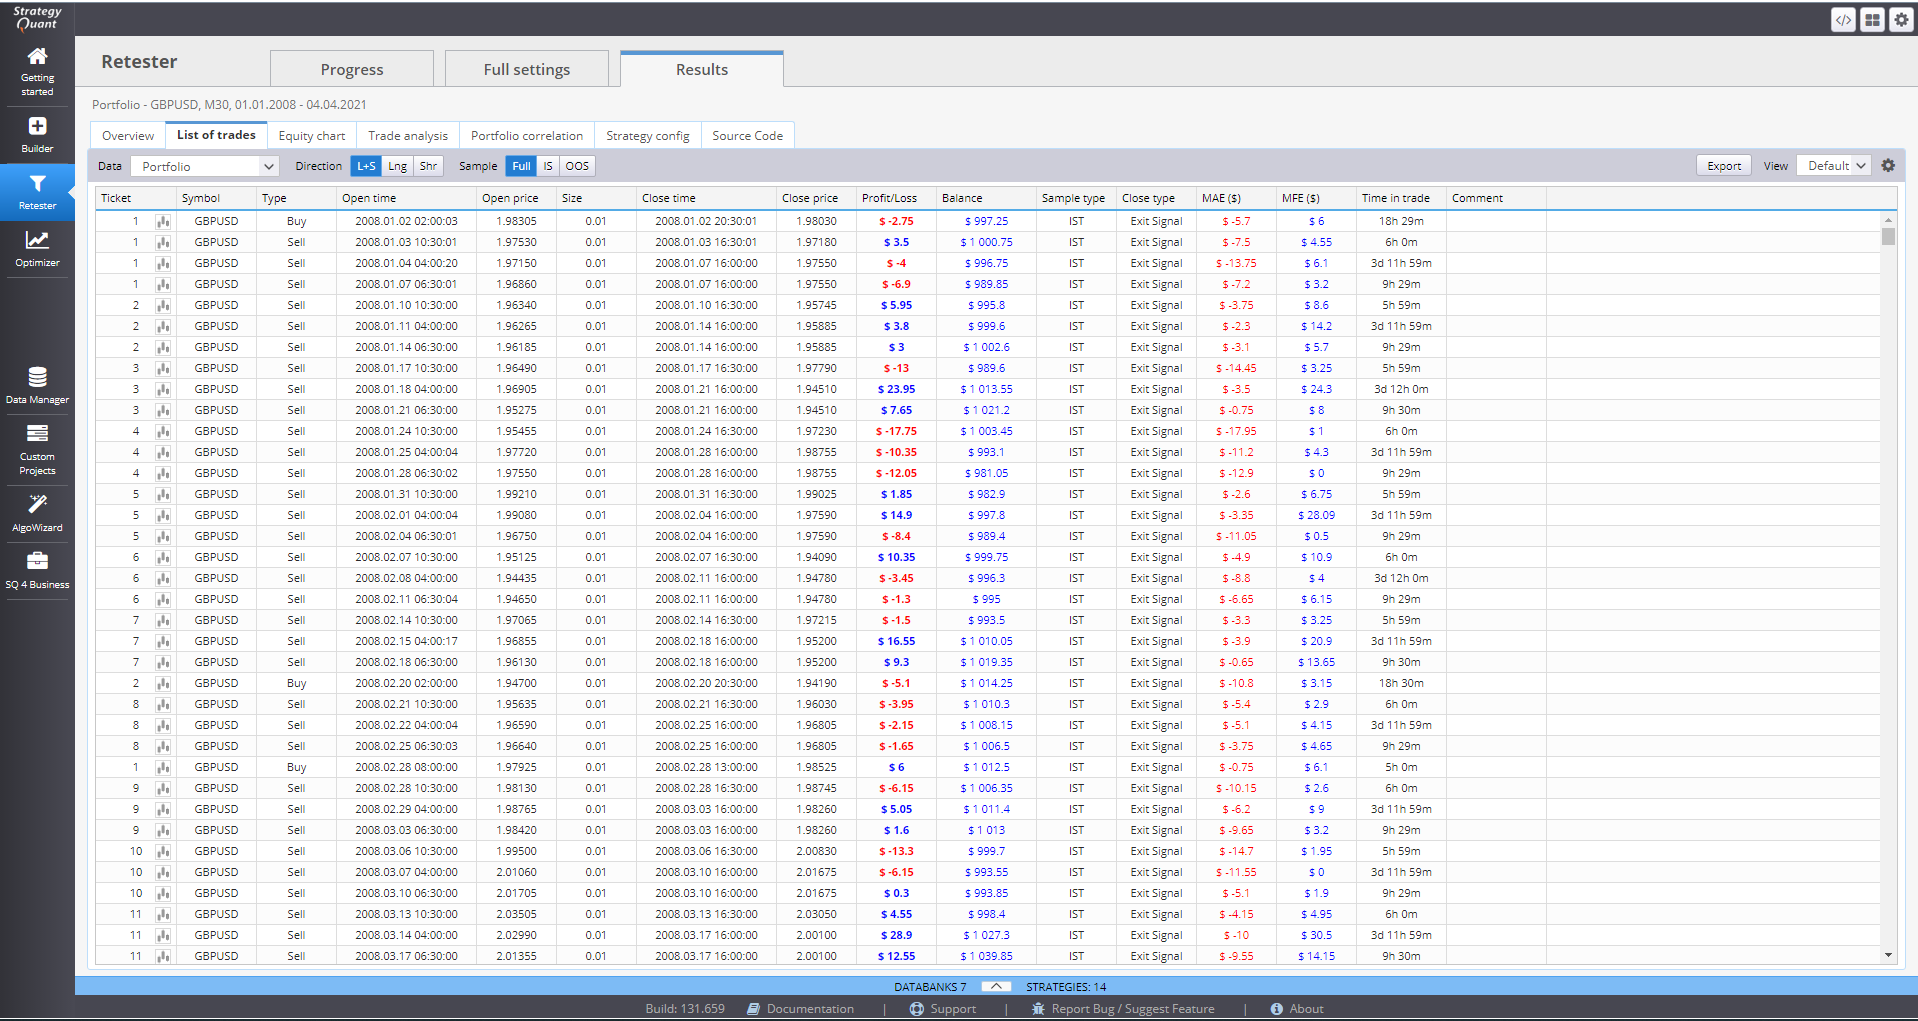
List of trades holds information of every retested strategy, recorded in the databank.
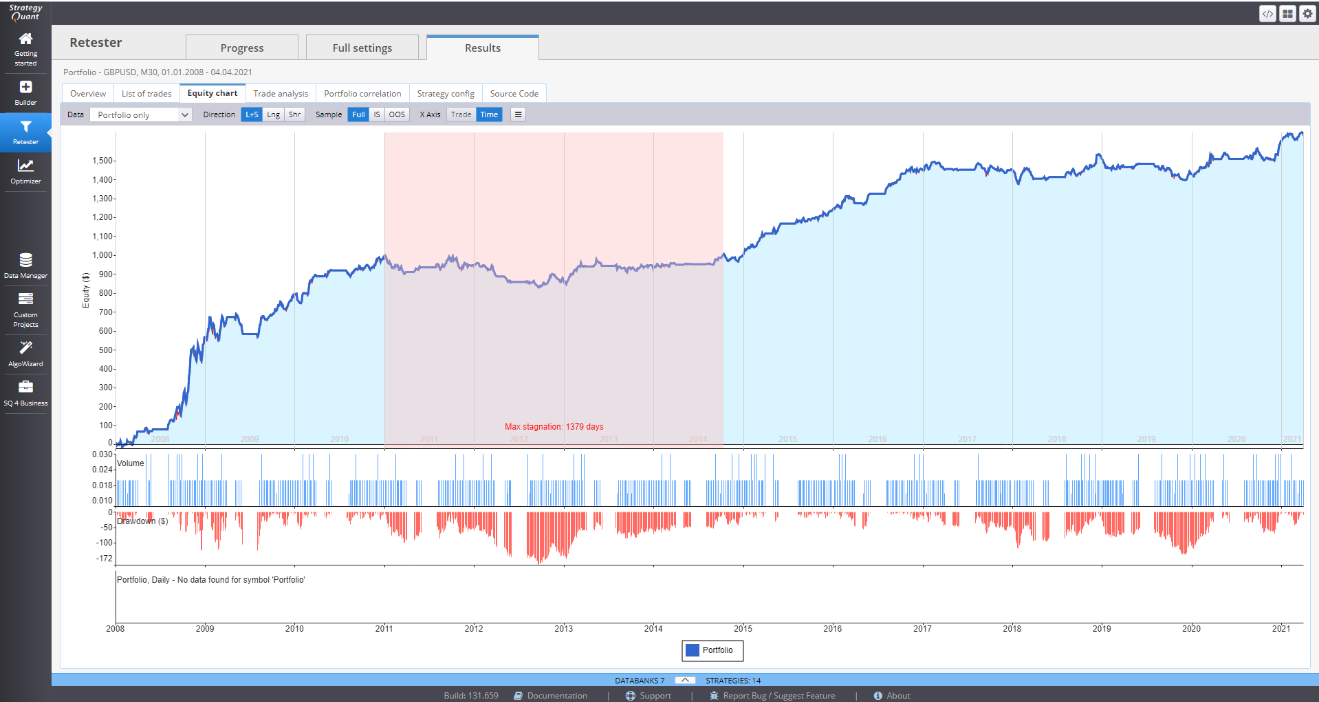
Equity chart can visualize the equity curve of a strategy.
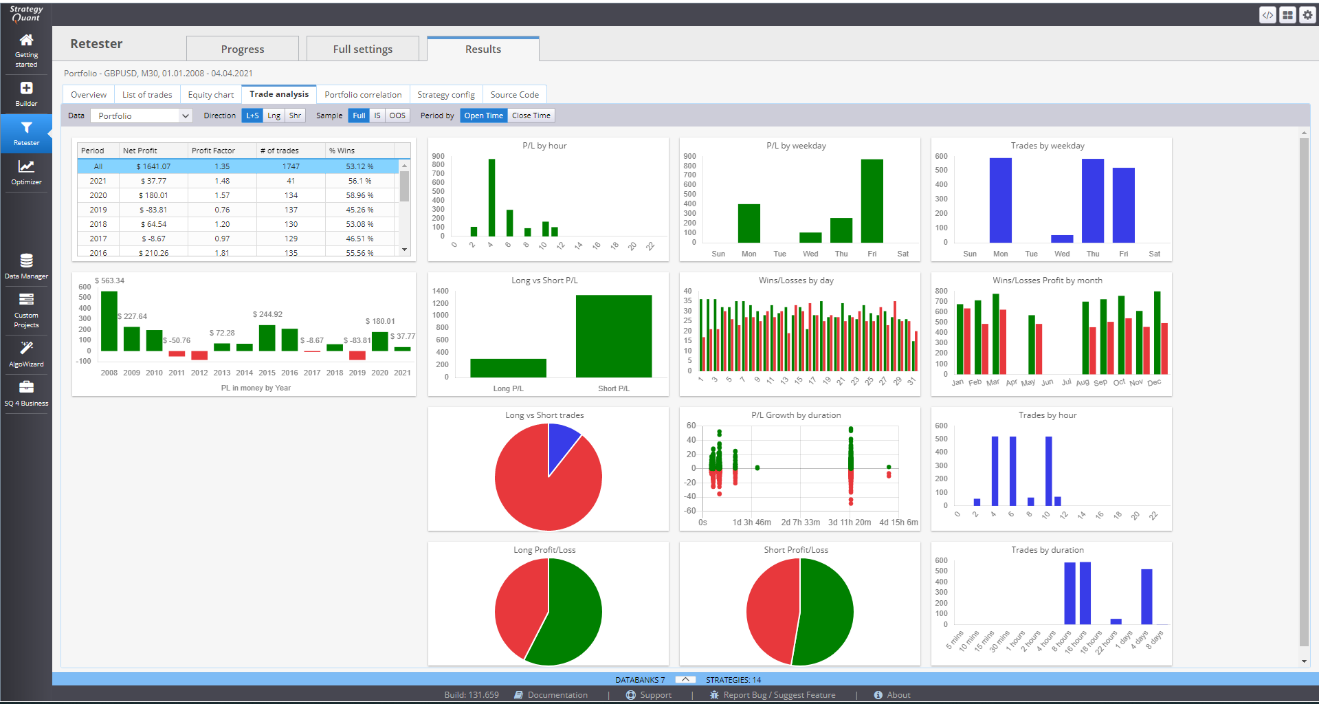
Trade analysis contains multiple charts for the performance of one strategy.
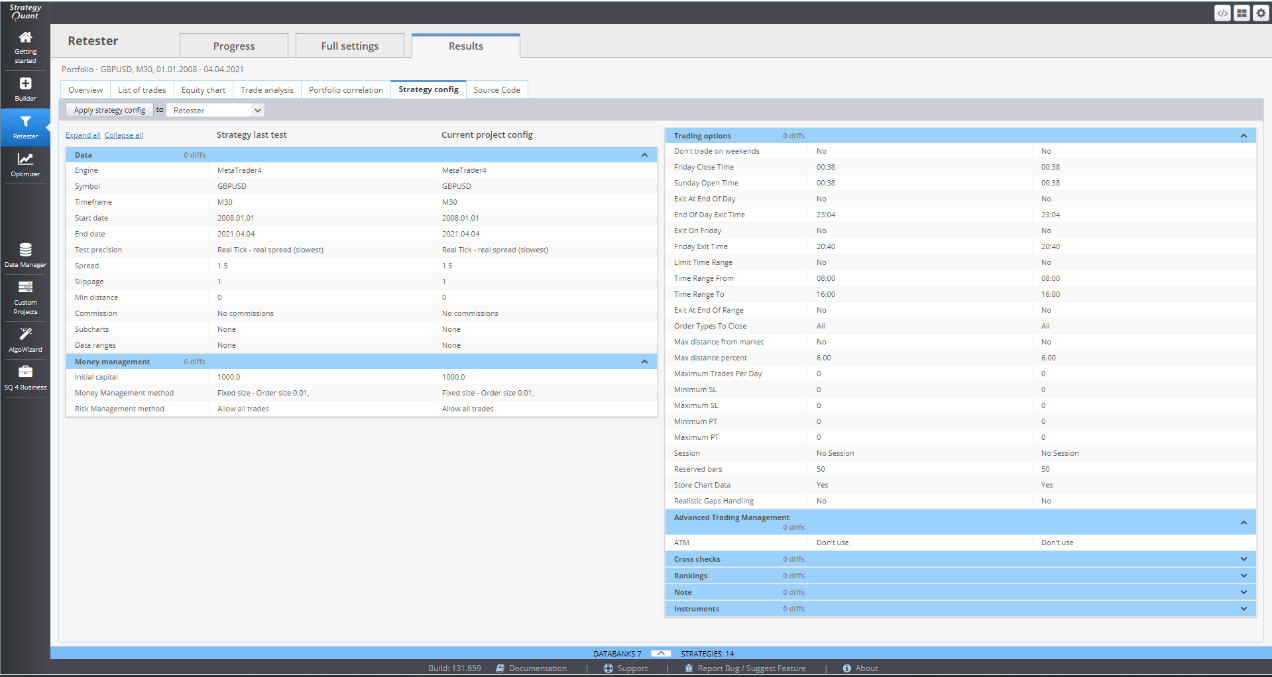
Strategy config is an overview of the current settings.
