BUILDER GUIDE
StrategyQuant X
CONTENT
INTRODUCTION
Builder is the core of StrategyQuant. It has the capacity to combine millions of different building blocks like indicator conditions, entry and exit rules, price levels, order types. It can filter the best performing strategies based on pre-set criteria. The platform keeps a database of the generated strategies for you to analyze, explore, develop further. You can easily export the full source code in a suitable form and import it directly in your trading platform or view it as pseudo code.
Builder has three main sections on its main screen:
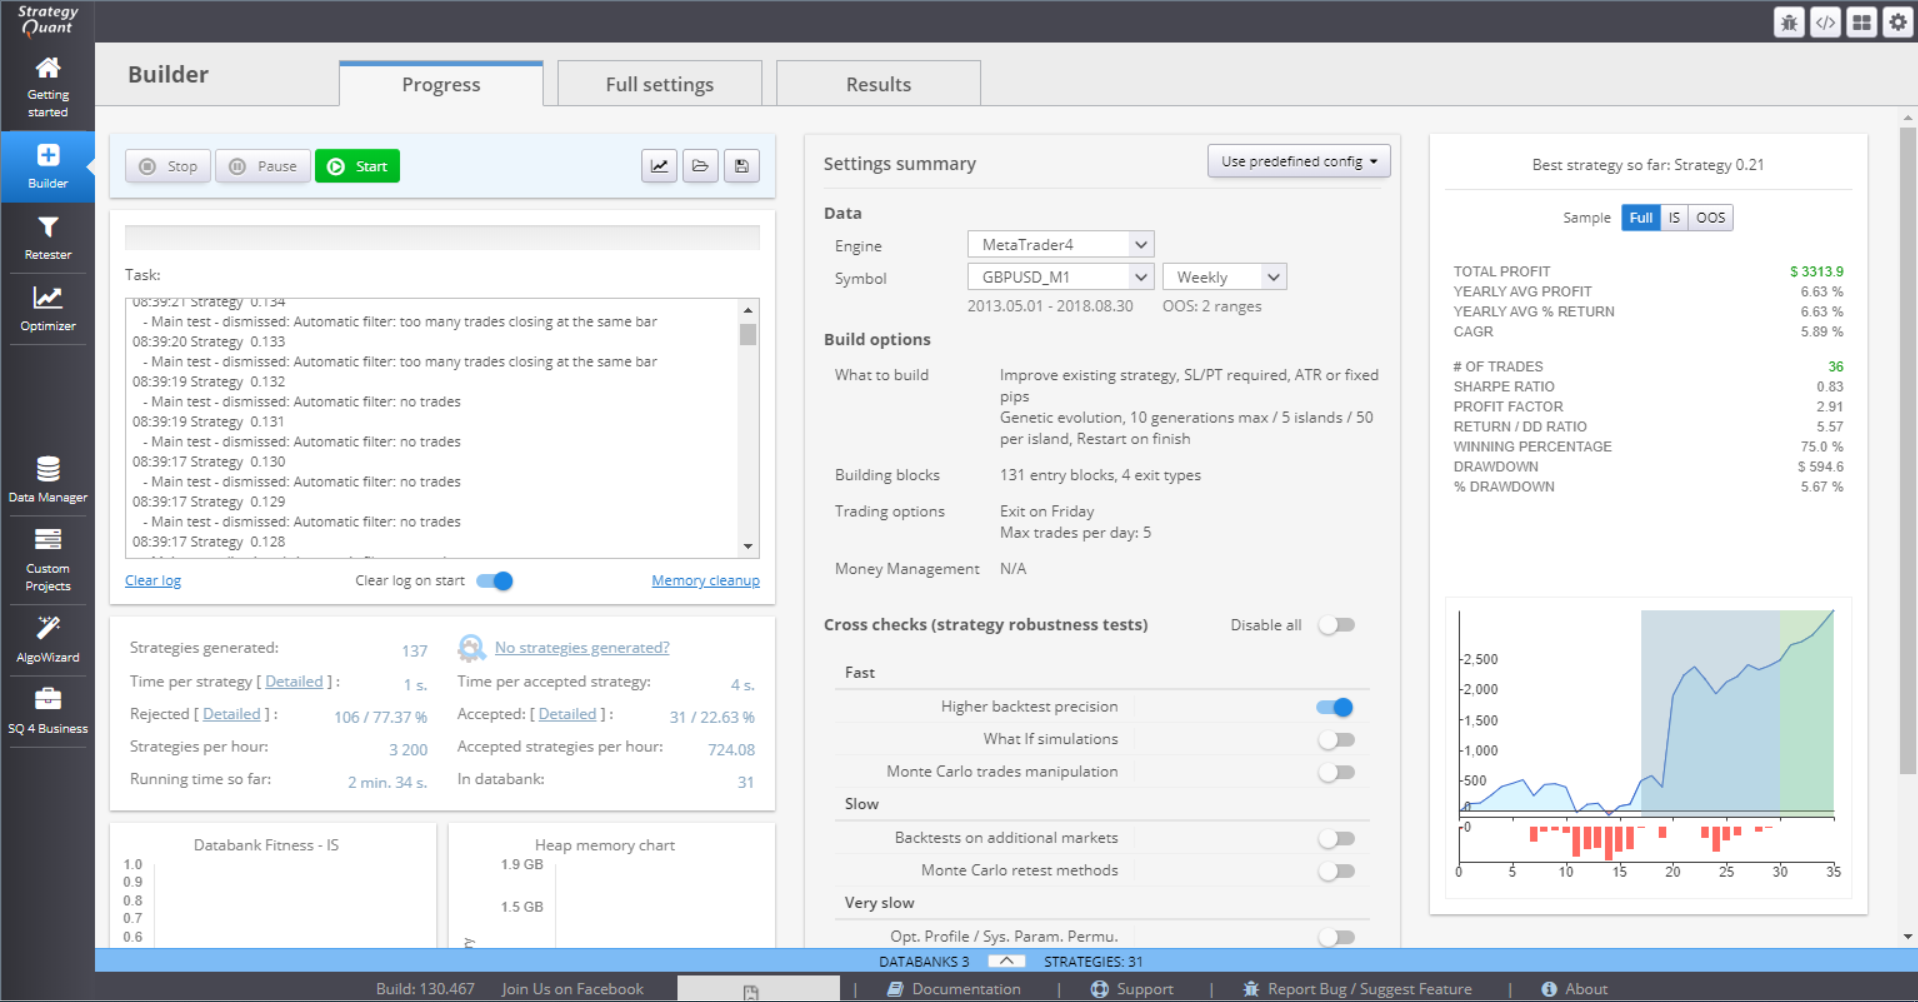
Progress (Engine) tab – this is where you can start or stop the task and follow its progress. You can monitor the statistics or quickly change a setting.
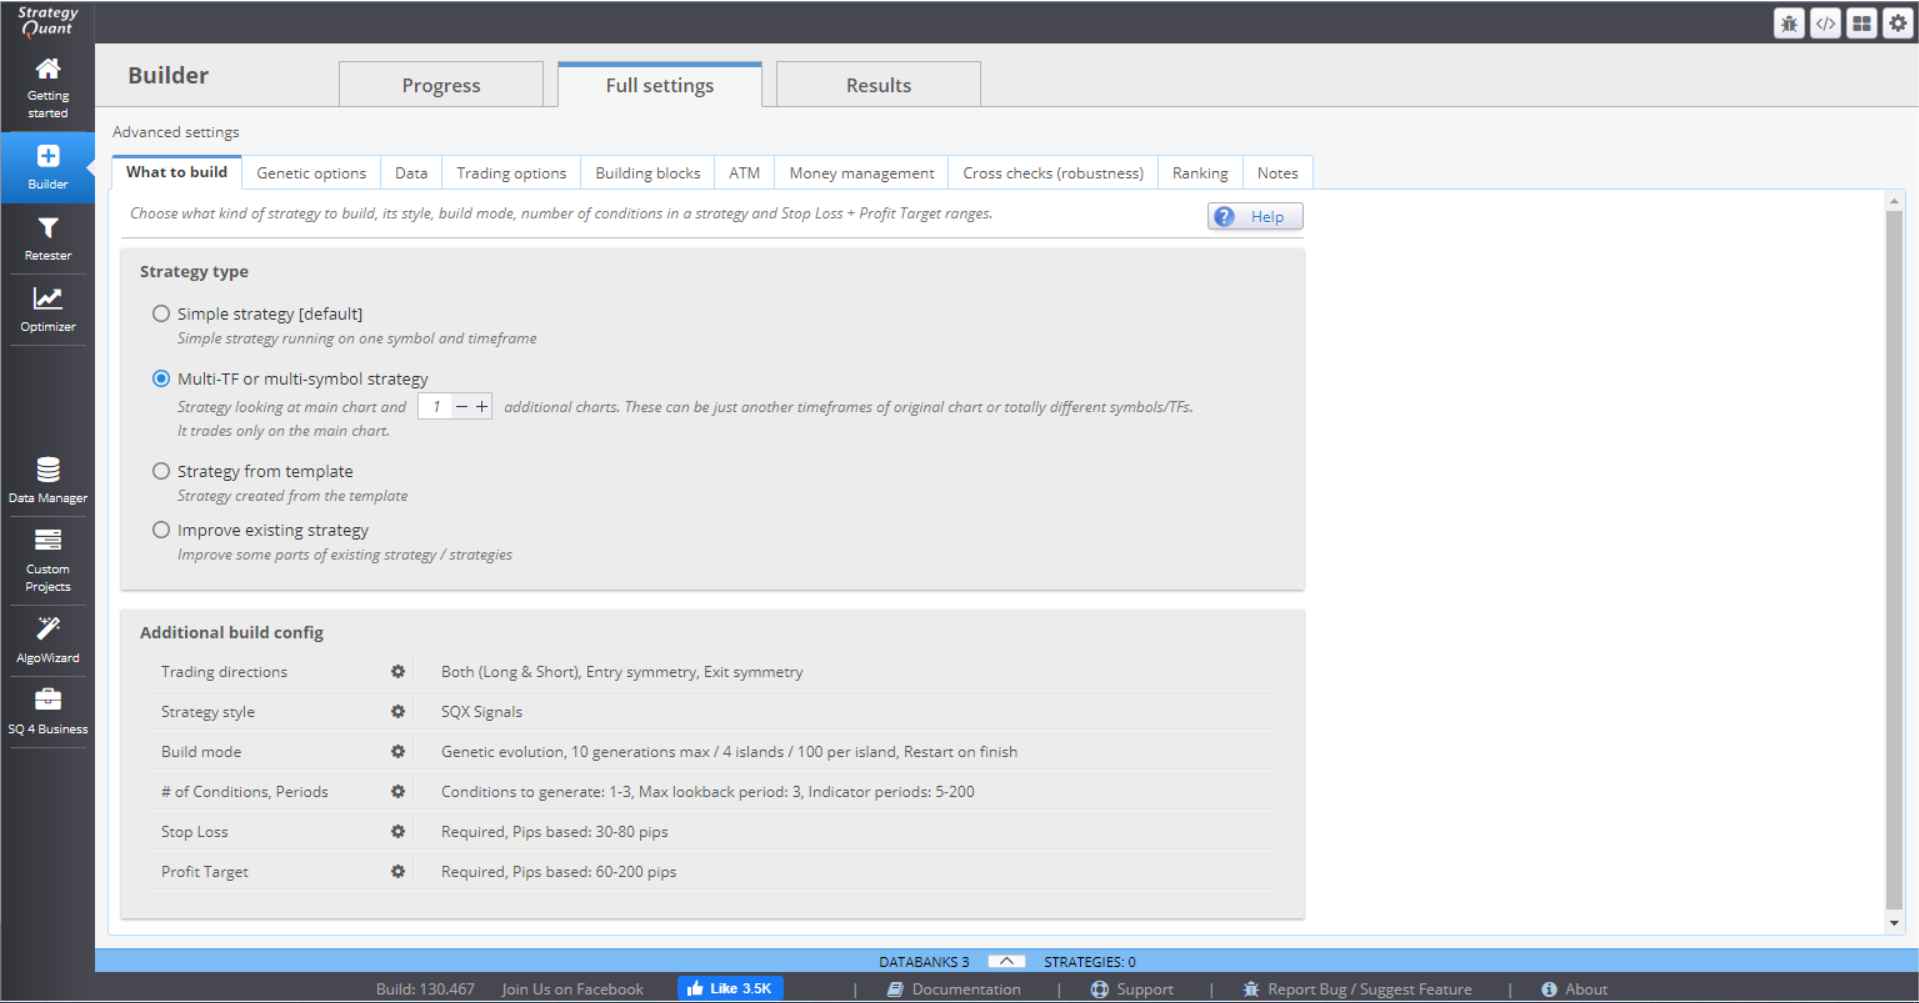
Full Settings tab – these are all the settings that can be configured for building your strategy.
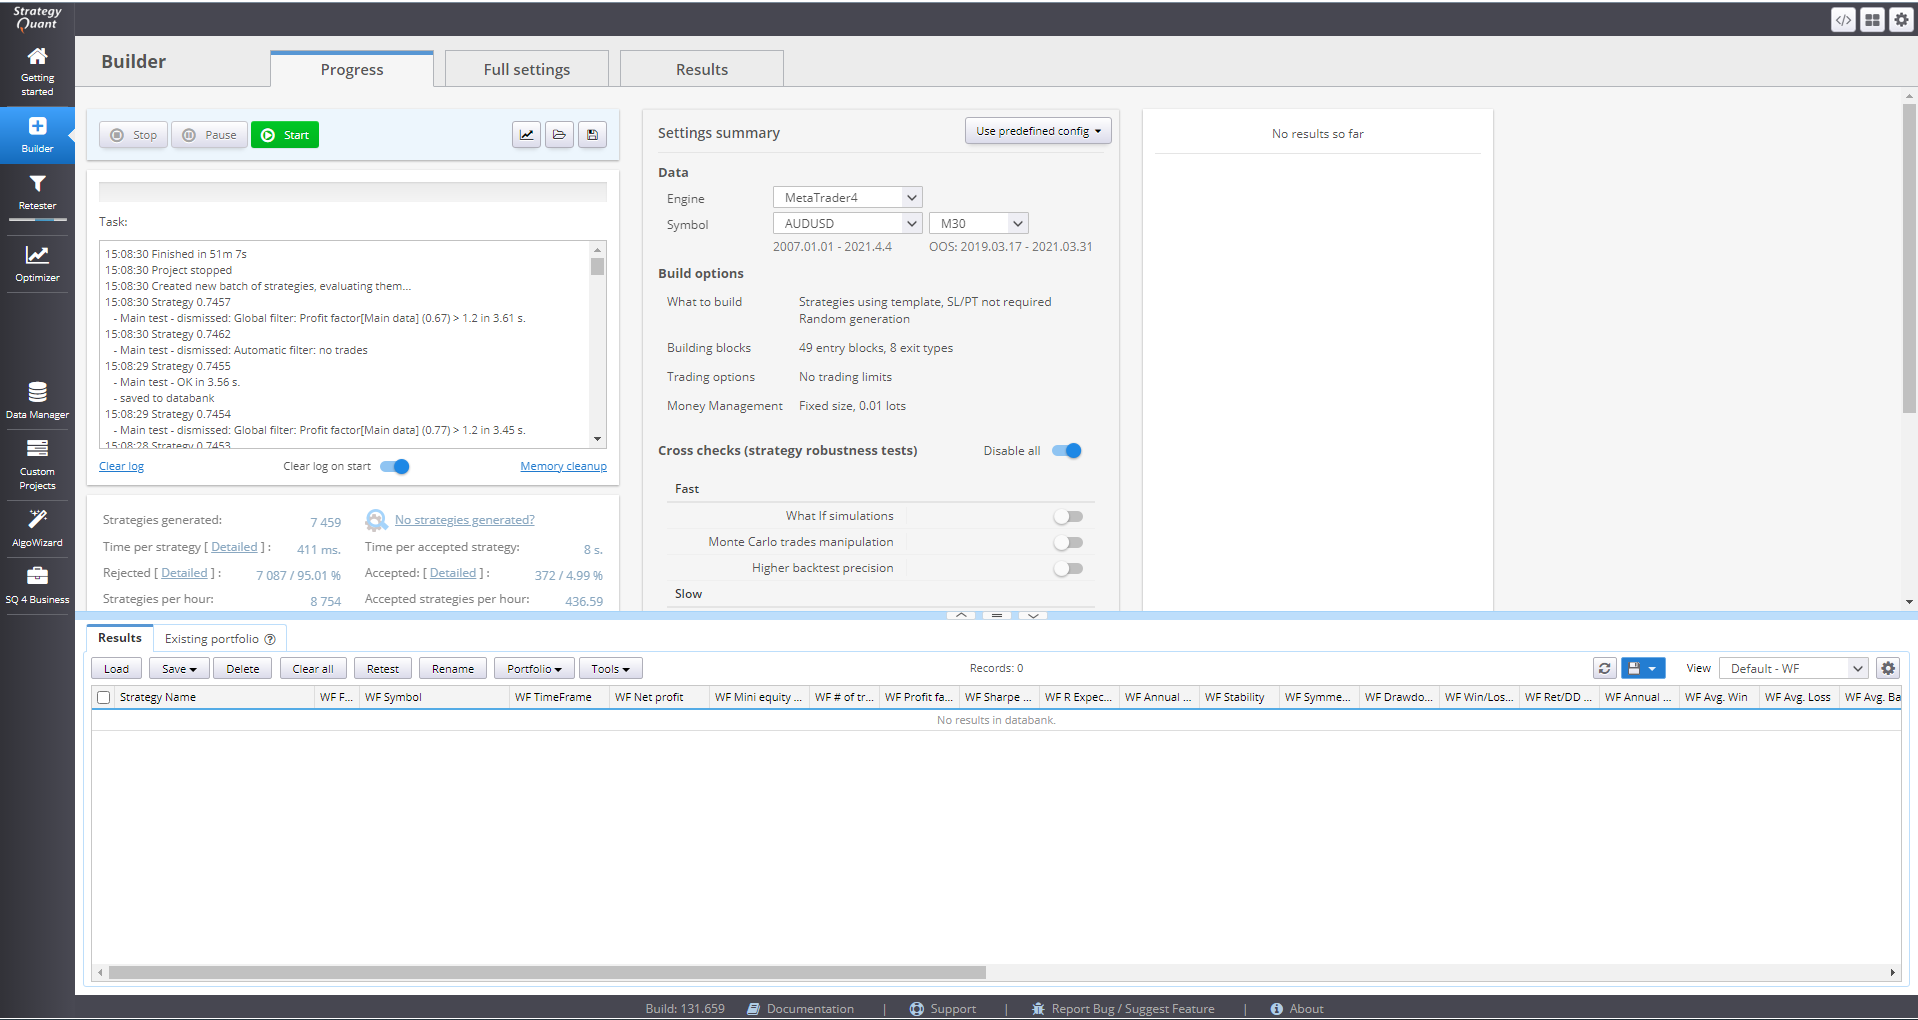
Results tab – shows the strategies that are generated and their statistics. Provides complete details in the form of charts and tables.
PROGRESS SECTION
This section shows a summary of the settings applied to the current strategy generation, as well as their overall progress. The first part of the screen contains a log where you can see each generated strategy and its assessment according to the strategy criteria.
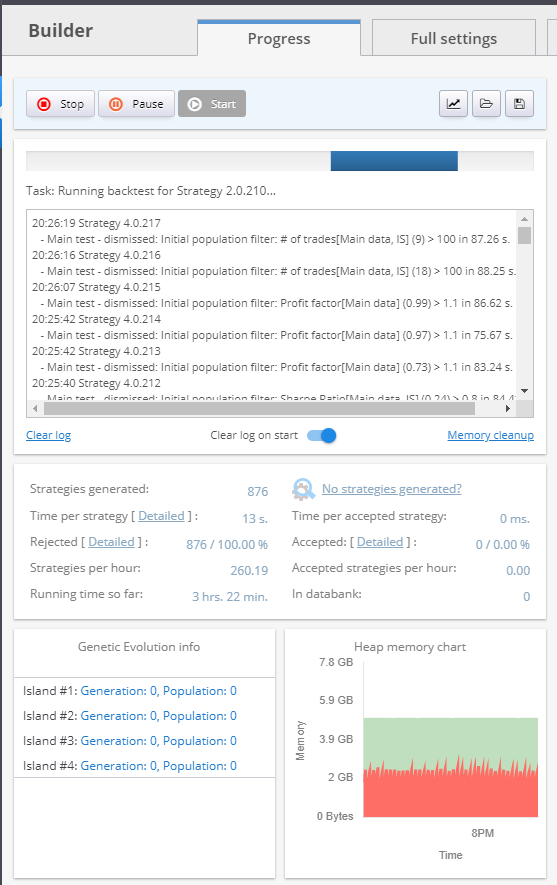
You can Stop, Pause and Start the generation process using the buttons on the top of the section.

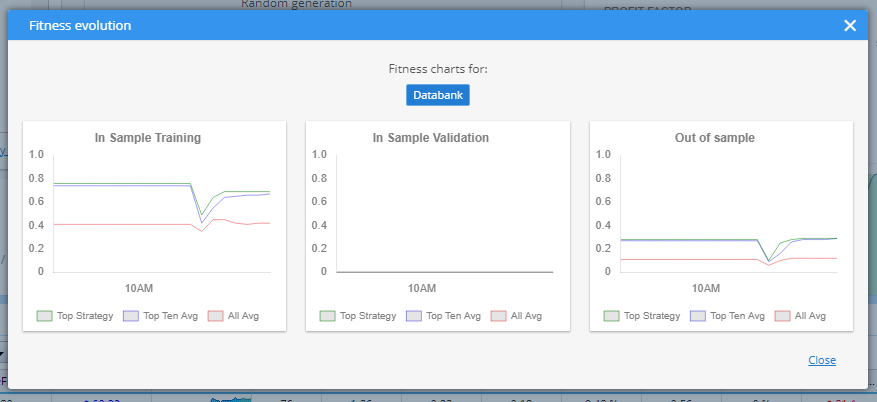
You can Load settings, or Save your progress. There is also a set of charts, in the Fitness evolution button, that give you a graphical evaluation of various characteristics.
There is a summary of the strategy generation that gives details like time elapsed on the generation of one strategy, the rejection rate, time since process start, etc.

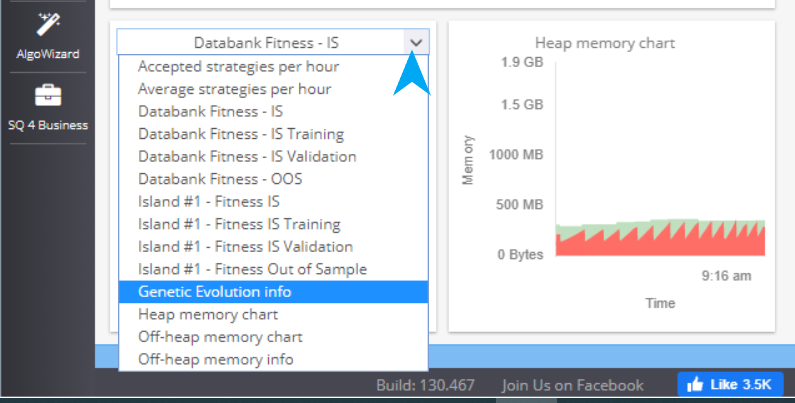
The charts on the bottom are configurable so you can choose what to see.
You can make some quick adjustments to the settings in the Settings Summary part.
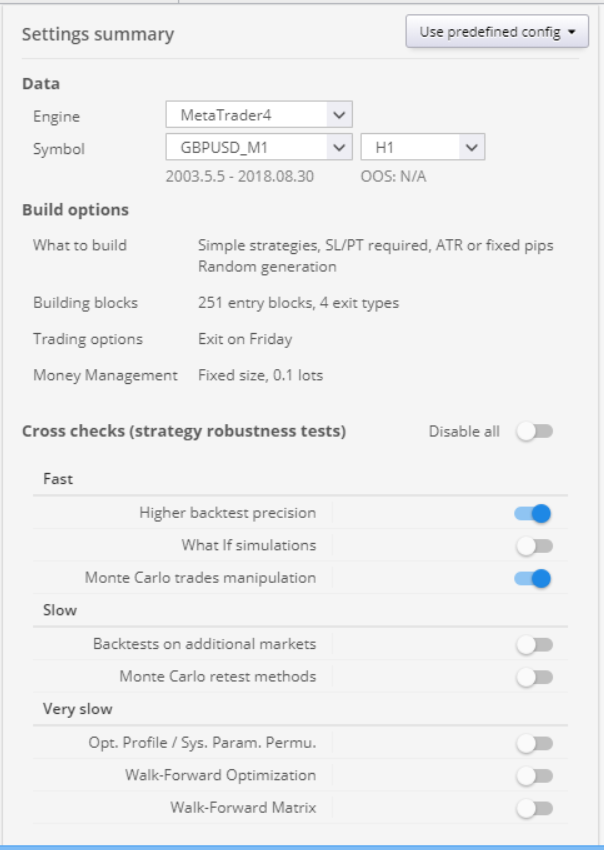
Data holds information about the chosen trading platform, symbol and timeframe. Build options show a brief overview of the set parameters. Cross checks panel is an easy way to toggle on and off the strategy robustness tests.
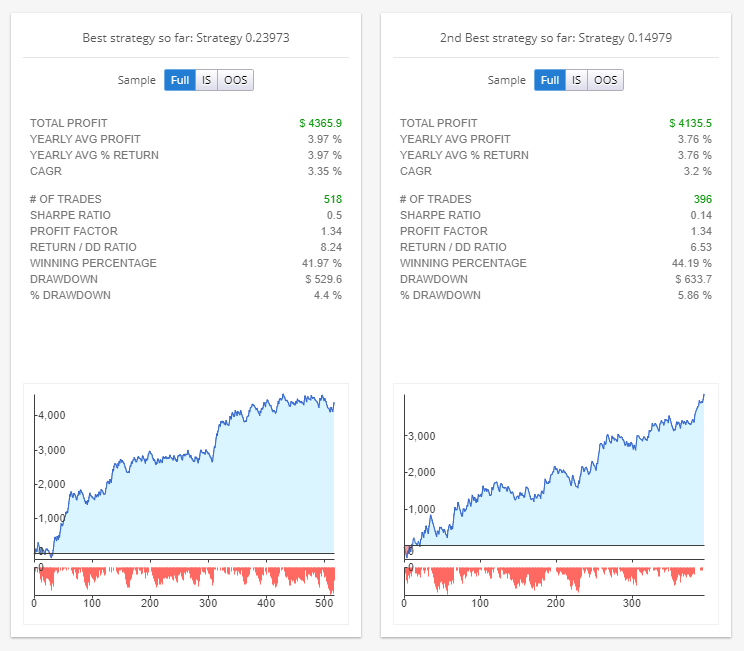
The third panel is Results. You can see some statistics of a chosen strategy here. If you click on the panel, it’ll lead you to the Results menu, where you can get full details of the strategy.
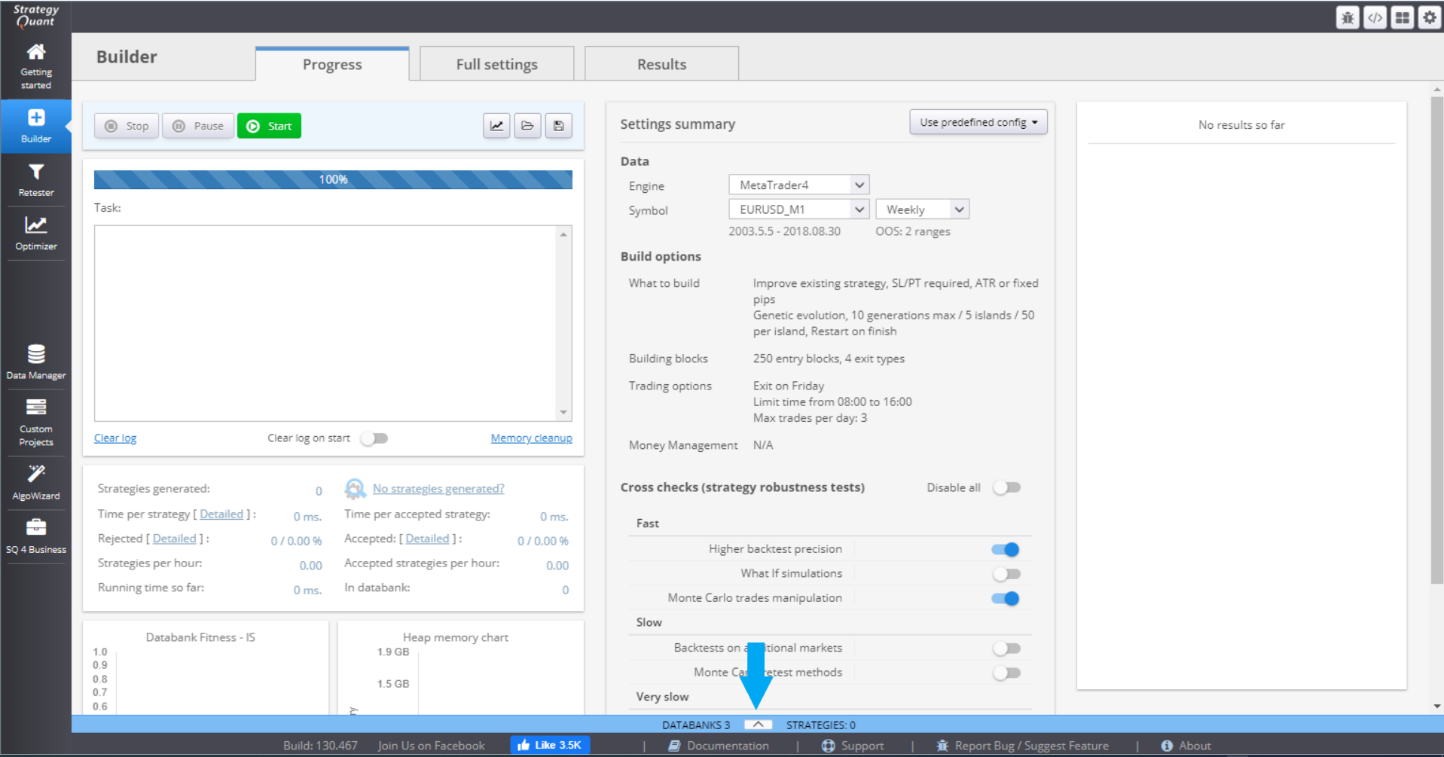
Databank can be accessed by clicking the arrow in the middle/bottom part of the Progress window. It stores the currently generated strategies.
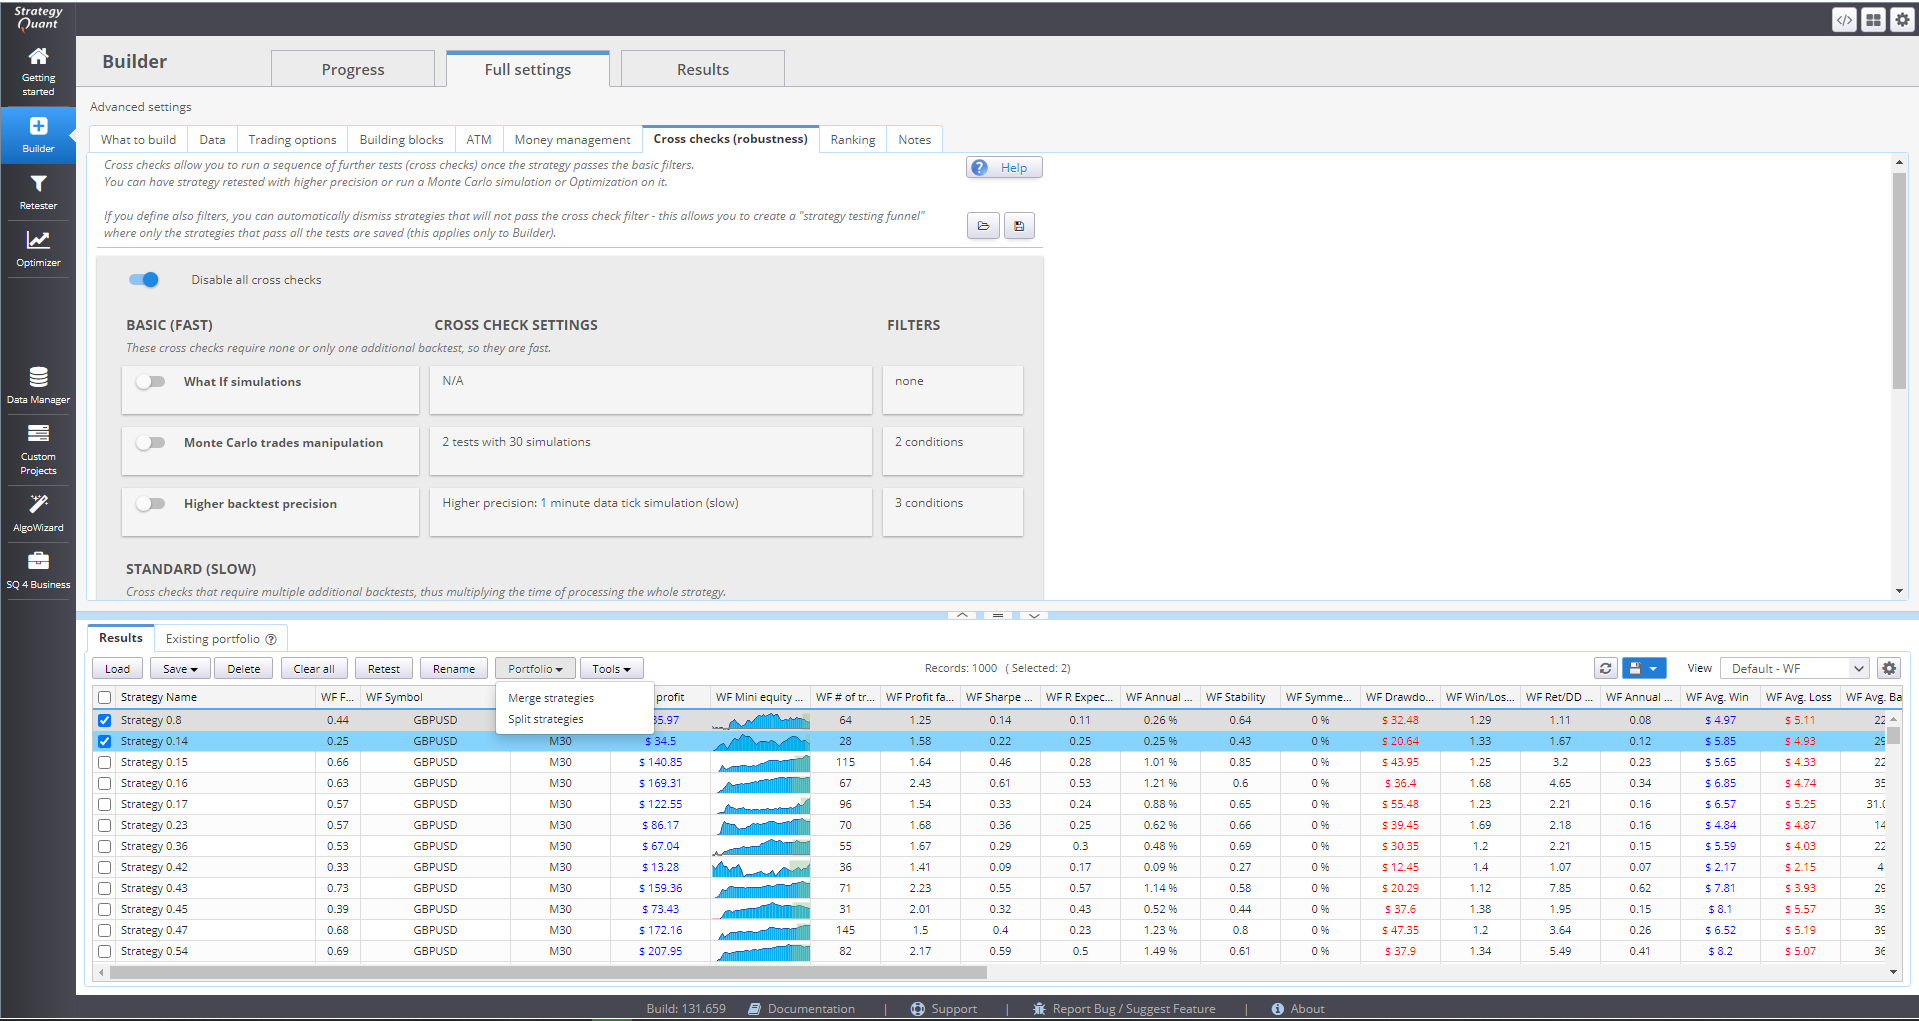
You can perform multiple actions with the data. You can sort them using different parameter, save or load data. If you double-click an item, its details are opened in the Results tab.

You can create a portfolio of strategy using the button Portfolio in Databank. Just choose the strategies that you want to combine and press the Merge strategies button.
You can change the name of your portfolio and the desired databank. Simulated portfolio combines the selected strategies to provide a cumulative perspective for their result. It combines the trades from all of them and computes statistics on the overall performance. You can see them in the Results charts and tables.
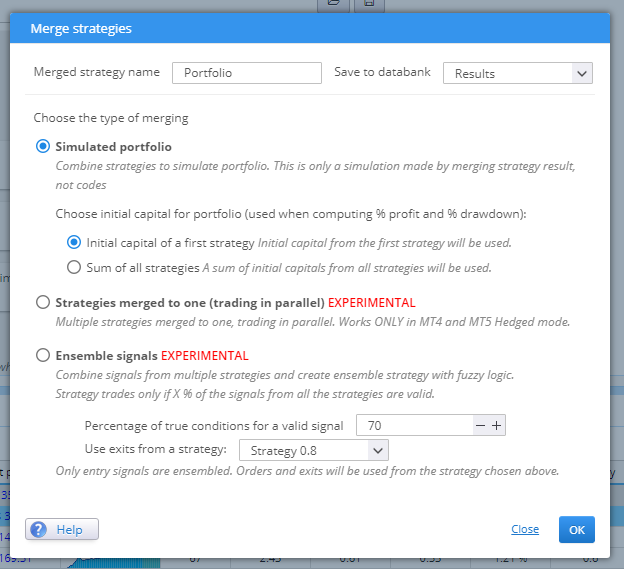
Choose whether the initial capital of your portfolio will be equal to the initial capital of your first strategy, or to the sum of all the initial capitals of the strategies within the portfolio. This influences the values of parameters, calculated as percentage of this value and you should keep this in mind, when reviewing the results.
You cannot export source code of a portfolio. Every strategy within it has its own source code that can be saved in multiple formats. The portfolio itself serves as a means to evaluate the strategies as a combination, yet, it is up to the trader to decide how to trade them in the real market.
FULL SETTINGS SECTION
This is where you choose all components that would be included in the strategies development. You set their values, boundaries, conditions, restrictions. You choose the cross checks and the filtering criteria for the strategies.
WHAT TO BUILD
In this tab you manage the main characteristics for your strategies. This is where you define your timeframe, additional charts and position rules.
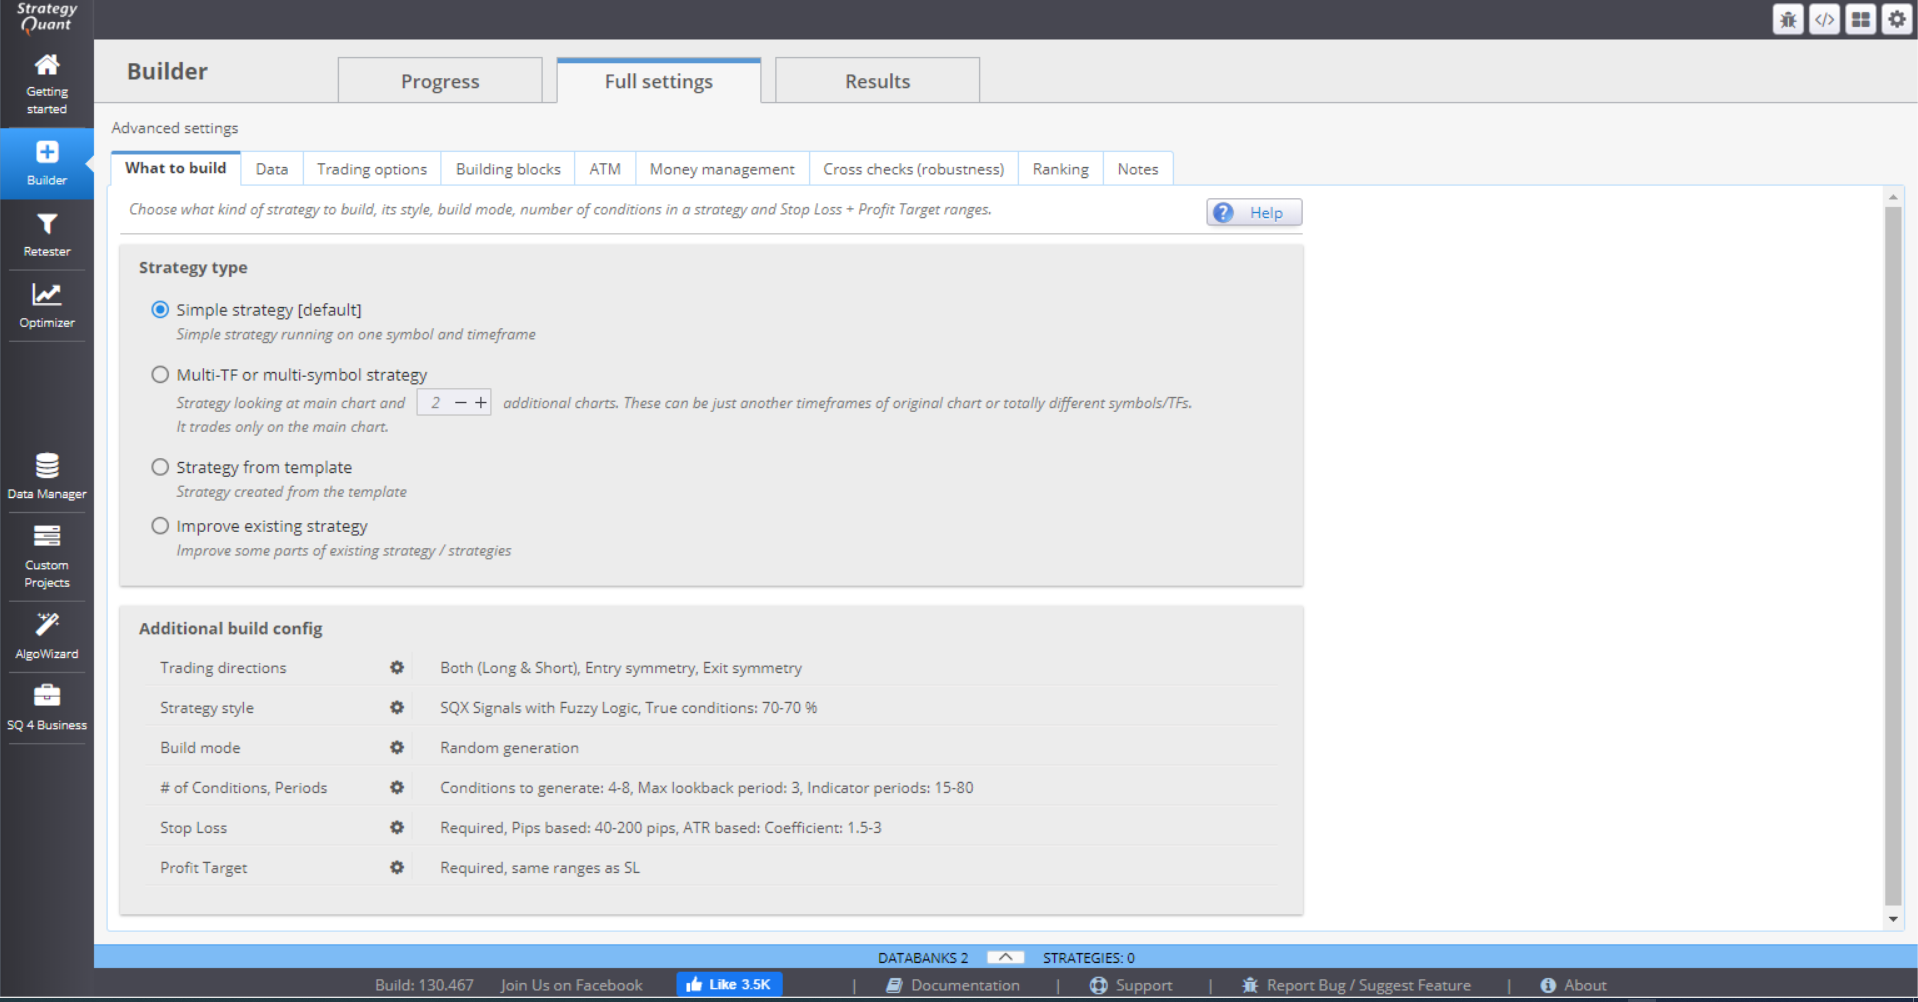
» STRATEGY TYPE
In the Strategy type section, you can choose one of four options.

› Simple strategy – runs on one symbol (currency pair) and one timeframe.
› Multi-timeframe or Multi-symbol strategy – the strategy executes trades on one chart, but monitors data from a different timeframe / same symbol chart or different timeframe / different symbol chart. You can set as many additional charts as you need.
› Strategy from template – you can use your own template (e.g. created with AlgoWizard) here. This allows you to generate strategies that are different from the standard SQ X architecture.
› Improve existing strategy – you can upload a strategy so that you can change (add or replace) parts of it. If checked, a new tab menu opens next to What to Build, called Parts to improve, where you can mark your preferences.
In Additional Build config you define the position parameters.
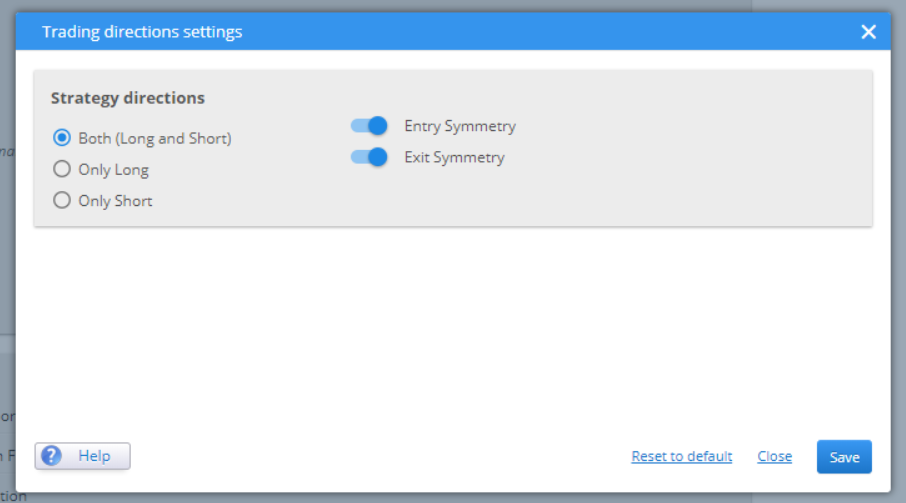
» TRADING DIRECTIONS
Choose to trade only in one direction, or both. You can set the long and short rules to be symmetrical or not.
» STRATEGY STYLE
There are 3 different trading styles in SQ X:
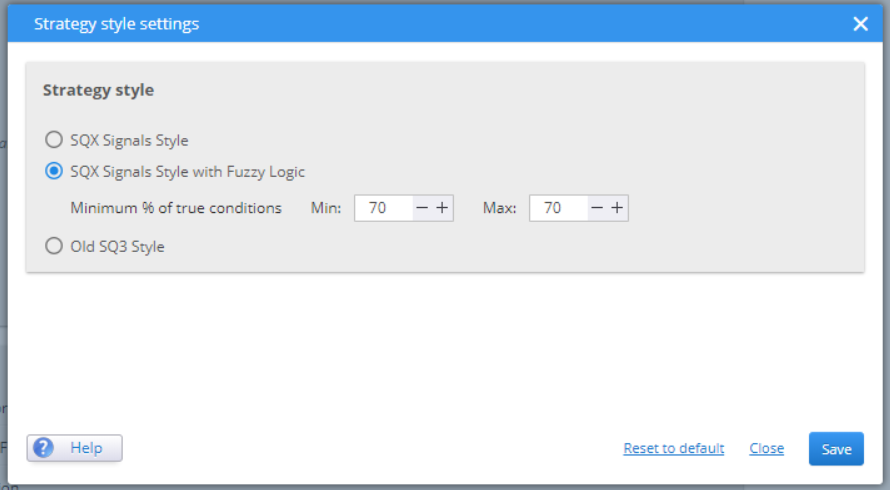
› The simple trading style (or the old SQ3) has a clear and logical format. It is based on simple If-Then rules:
LONG ENTRY RULE
IF Long Entry Conditions THEN Open Long order
SHORT ENTRY RULE:
IF Short Entry Conditions THEN Open Short order
LONG EXIT RULE:
IF Long Exit Conditions THEN Close Long order
SHORT EXIT RULE:
IF Short Exit Conditions THEN Close Short order
But this can give ambiguous signals at times. It can so happen that the rules for short and long entry are both true at the same time and the strategy would then open positions in both directions.
› The newer SQ X style is an advanced and upgraded version of SQ3. It is again based on If-Then rules, but the logic is more complex:
SIGNAL RULE:
LongEntrySignal = Long Entry Conditions
ShortEntrySignal = Short Entry Conditions
LongExitSignal = Long Exit Conditions
ShortExitSignal = Short Exit Conditions
LONG ENTRY RULE:
IF LongEntrySignal = true and ShortEntrySignal = false
and LongExitSignal = false THEN Open Long order
SHORT ENTRY RULE:
IF ShortEntrySignal = true and LongEntrySignal = false
and ShortExitSignal = false THEN Open Short order
LONG EXIT RULE:
IF LongExitSignal = true and LongEntrySignal = false
THEN Close Long order
SHORT EXIT RULE:
IF ShortExitSignal = true and ShortEntrySignal = false
THEN Close Short order
These more complex checks make sure that the strategy would open a position only when there is a clear signal for a trade and would do nothing if the signals are ambiguous.
› SQ X with Fuzzy logic includes multiple conditions that are evaluated based on a percentage of them being true.
SIGNAL FUZZY RULE – 70% have to be true:
LongEntrySignal:
CCI (14) > 0
RSI (20) > 50
MACD (10, 20, 30) > 0
Hammer Candle Pattern
This is not a standard AND/OR logic. The conditions are evaluated as a whole and the strategy would open a position when the signal fuzzy rule rates above the pre-set percentage. That means that some conditions in the fuzzy rule can be true and some can be false, as long as the ratio is high enough to meet the criterion. This option only makes sense if you want to evaluate more than 2-3 conditions.
» BUILD MODE
This is where you choose the method for generating the initial population of strategies.
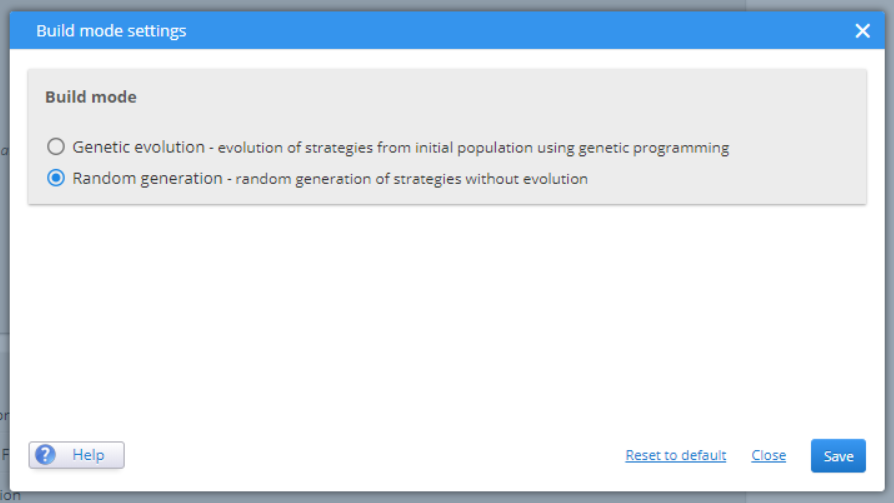
› Genetic evolution
The first population of strategies is generated using Random evolution mode. Then a genetic evolution process is used to evolve better candidates. The process ends when your predefined number of generations is reached or when there is no further progress.
Strategies can be divided into separate islands so that they evolve independently from one another. There are settings to define a migration rate and probability, as well as the stage of development (at which generation) that can happen. The strategies within one island can be set to evolve at a controlled pace of mating and mutation, meaning you define how much they can mix. Larger values would produce more diverse candidates. The process is time-consuming, especially if you have many islands and large populations in them. So, you should work with optimal values to ensure a balance between speed and quality.
If you choose this method of generation, a new tab menu appears, called Genetic options.
› Random generation
This mode continuously generates random strategies. It evaluates them in the process, based on pre-set criteria and filters out the poor-performance ones. The process runs until you stop it, so, in theory, the longer you let it run, the greater the possibility for a successful strategy.
» # OF CONDITIONS, PERIODS
These settings determine the applicable ranges. The strategies that would be generated then randomly take different values from these ranges.
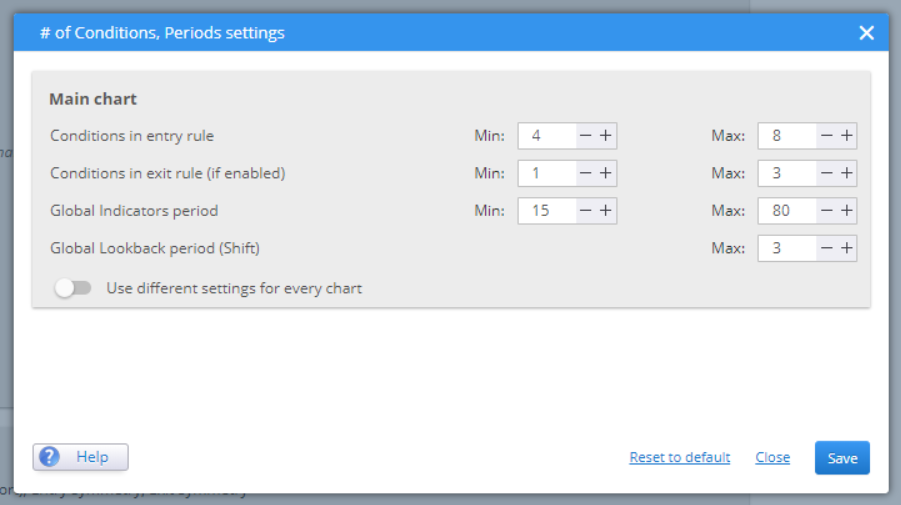
If you have chosen to work with Fuzzy rules, it is important to set the minimum values for the entry and exit rules to at least 3 or preferably even more. The idea of fuzzy logic is to evaluate larger number of conditions at once. If you have chosen one of the other two modes (SQ3 or SQ X) then you should put the min – max range to 1 – 3, for example. The random process for generating a signal would then combine them by randomly adding AND / OR logical operators between them.
Global indicator period sets the min and max period that the building blocks can use. It does not make sense to put too large numbers here, as the data will not be so relevant to the current market situation.
Global lookback period (Shift) indicates the maximum periods that indicators can use and look back to. Just like the Global indicator settings, it does not make sense to set large values. It is also not advisable to use 0 for max shift, because that would mean that indicators would use some value from the currently developing period, which could potentially alter the results. The optimal values for Shift are in the range of 1 to 5 periods.
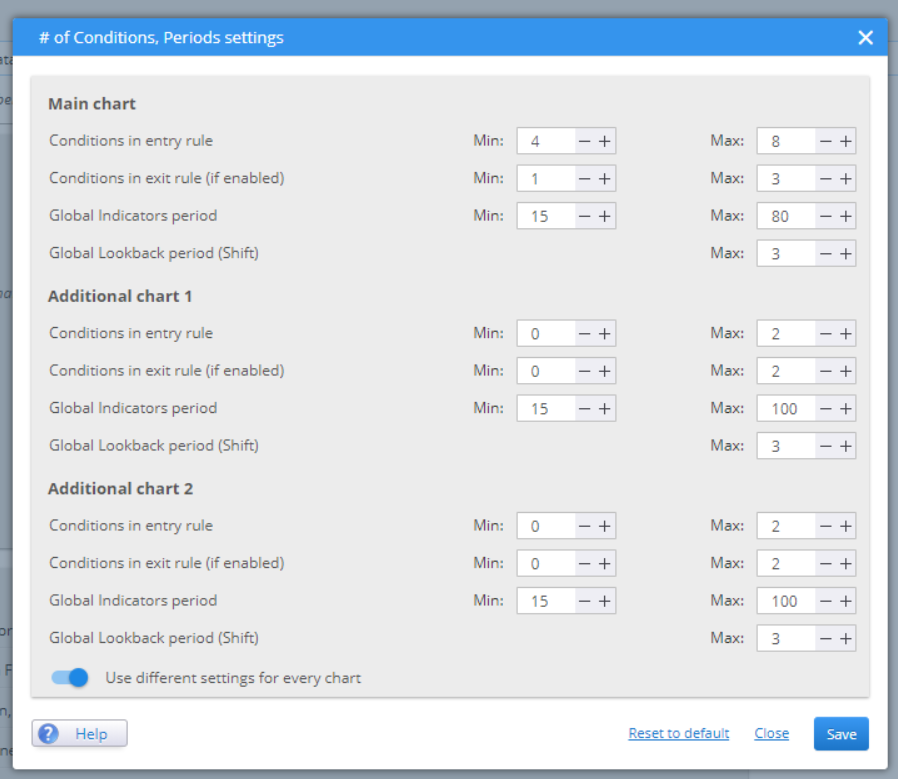
If you are using Multi-Timeframe or Multi-Symbol charts you can set different ranges for every chart. The option is available when toggling the button Use Different Settings for Every Chart.
» STOP LOSS
Stop Loss settings is where you choose the SL values.
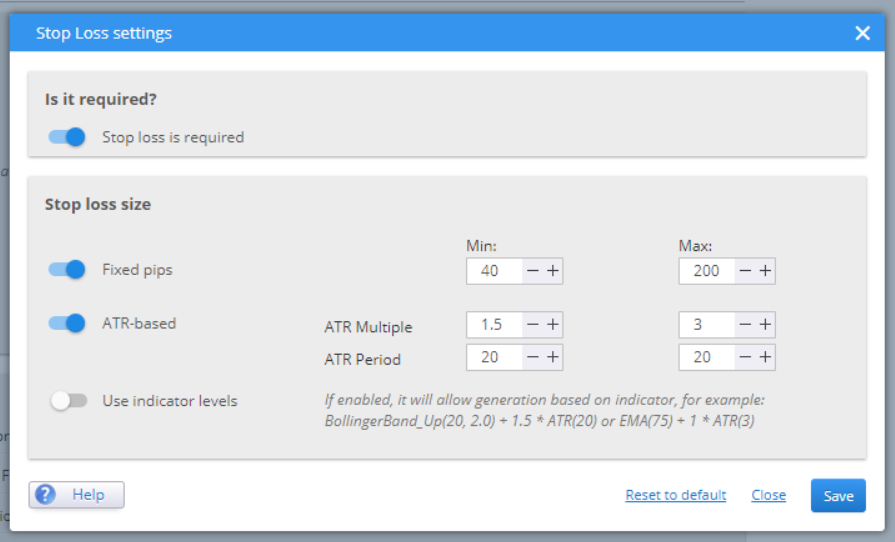
You can opt to not use SL, or choose between fixed pips value or ATR-based one. By setting the min-max range you allow the generation process to randomly use values from within that range.
» PROFIT TARGET
Profit target settings is where you define the TP target rate. You can choose to not have a mandatory TP or to have your TP use the same ranges as the SL.
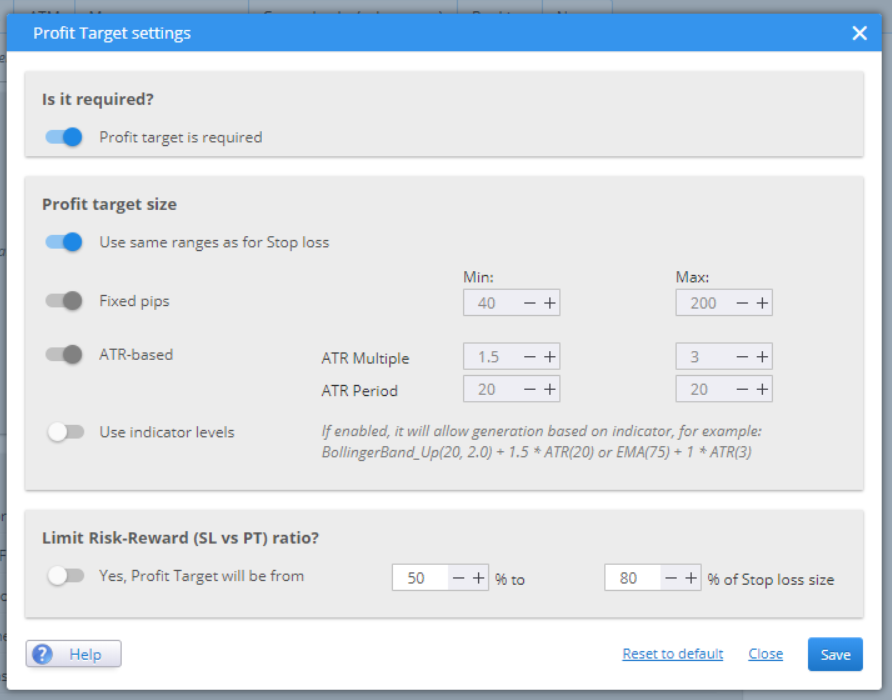
The Risk-Reward ratio can have a range or you can leave it inactive. In that case the strategies would randomly choose any ratio.
PARTS TO IMPROVE
This tab appears only if you choose to improve an existing strategy from the What to Build menu.
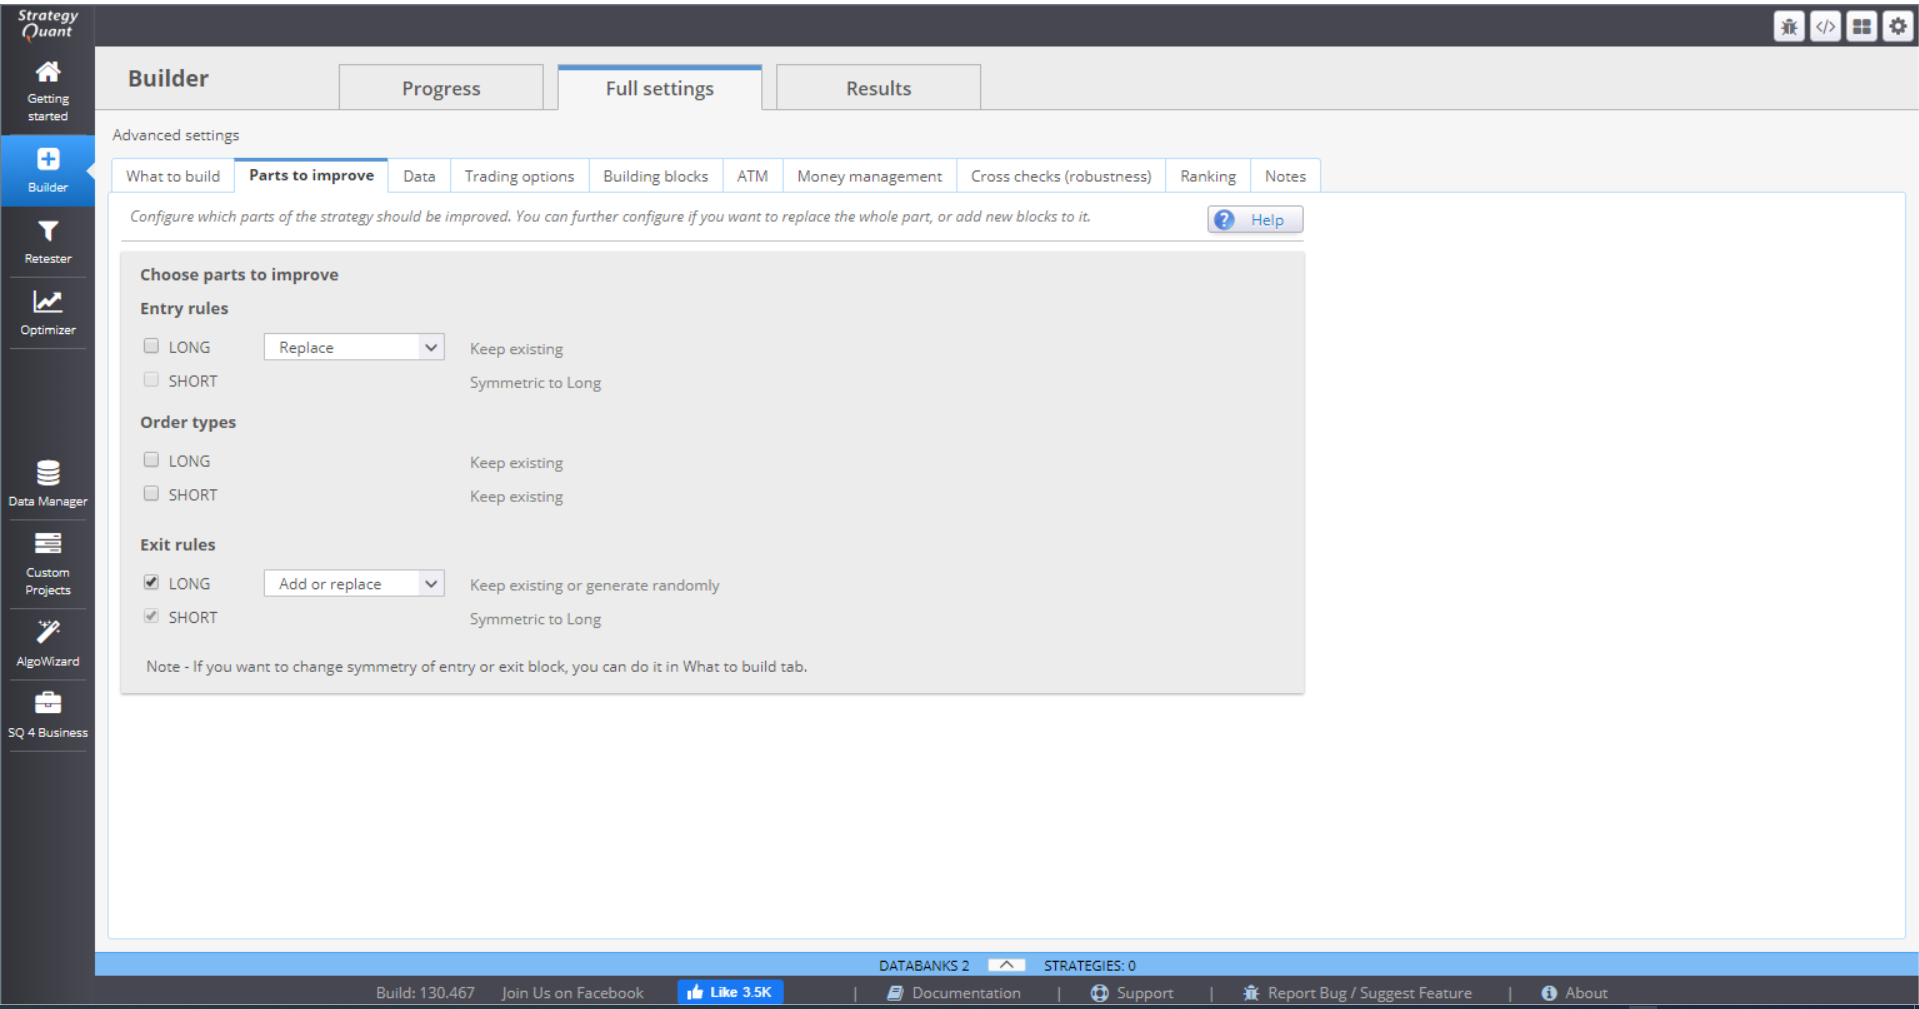
The menu provides the way to state what exactly conditions you want to improve. You can choose whether you want to Add conditions to the existing ones, Replace the old conditions with randomly selected new ones, or Add and Replace, which would combine both actions.
GENETIC OPTIONS
This menu appears only when you have selected Genetic evolution in What to build tab.
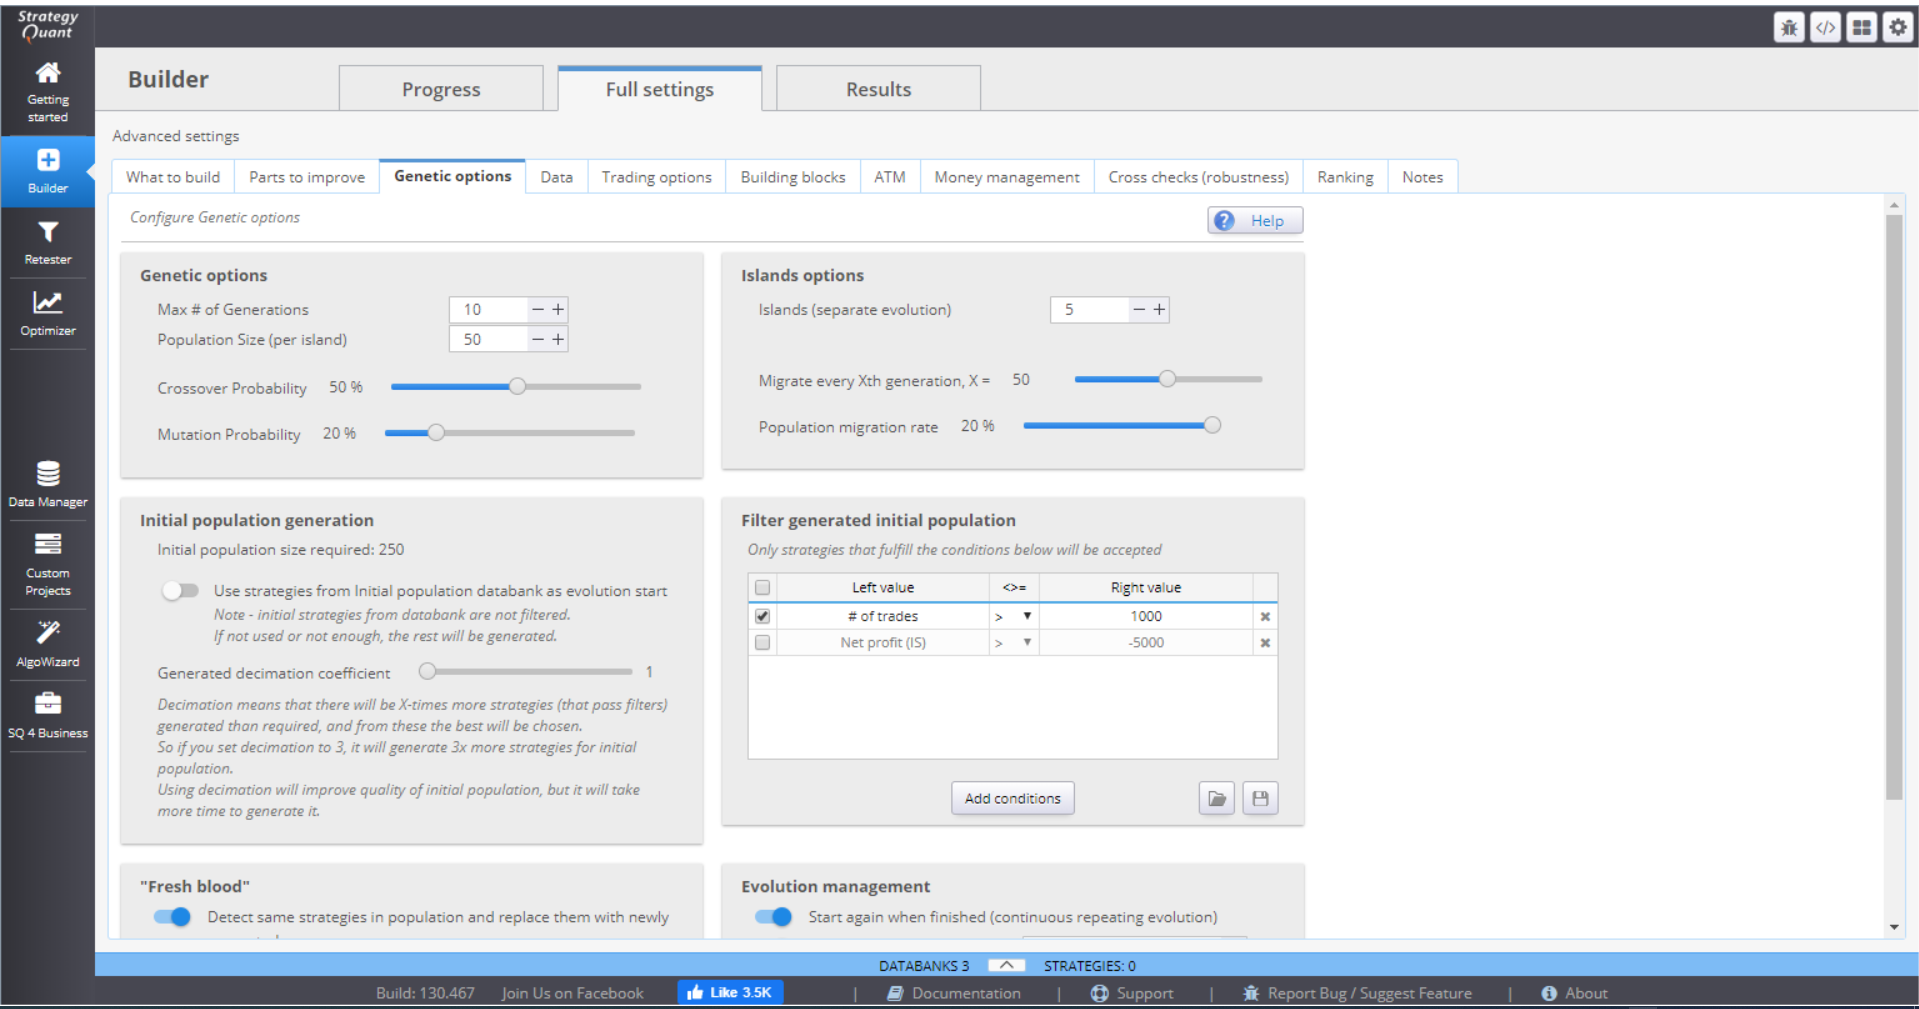
This is where you manage the genetic evolution settings.
⇒ Genetic options section is where you configure the number of generations that would be evolved. The recommended value is 5-100. It doesn’t make sense to keep the island going for too long. If the results are not satisfactory, it is much better to start over.
Next you choose the population size or the number of strategies on one island. You should set this number to 10-100 or even more.
Crossover and Mutation Probability configure the chance for genetic operations. There are no recommended values but a matter of choice. Increasing mutation rate, for example, should generate more diverse strategies.

⇒ Islands options is where you set the number of islands. It is good to have between 1 and 10 islands. The idea of evolving separate islands is to have unique generations that develop distinct characteristics.
You can migration rules. It is useful to migrate some candidates between the island, as this could help some island that got stuck with evolution. The rate should not be high, though, because this would harm the uniqueness of the populations. A reasonable choice is to migrate strategies every 10 generations. Population migration rate should be somewhere around 1-5 strategies. Knowing your population size, you can calculate the rate, e.g. for a population of 100, the migration rate would be 1-5%.
⇒ Initial population generation gives you the option to decide what your starting generation will be. The default setting is to let the genetic process develop its own randomly generated population. This is good option, as the candidates will have to pass the set filters to qualify.

The other way to populate your island is to use strategies from the Databank. Note that even though you might have set filters for the strategies, the imported first generation would not be filtered. If the strategies from Databank are not enough, the other candidates would be randomly generated.
Generated decimation coefficient is a way to provide a high-quality first population. It generates X times more strategies than required. X is the set coefficient. The best ones then form the initial population.
⇒ Filter generated initial population – this sets the filters for the initial candidates. It is good to set loose rules and let the genetic process optimize the strategies. A good option is to set the filters to rule out strategies with no trades, for example.
⇒ Fresh blood is an option to replace poor performing candidates or duplicates with new randomly generated ones. You can choose to see the last generation (of your 1st island only) in the Databank.

⇒ Evolution management gives two options.
› To start the evolution process over, once the number of generations has been reached.
› And to restart the whole process if there is no progress in a set number of generations.
You should choose optimal values to the genetic evolution parameters. Having too many islands, or too large population or decimation coefficient can slow down the evolution process significantly and unnecessary.
DATA
This menu contains the settings for your backtests.
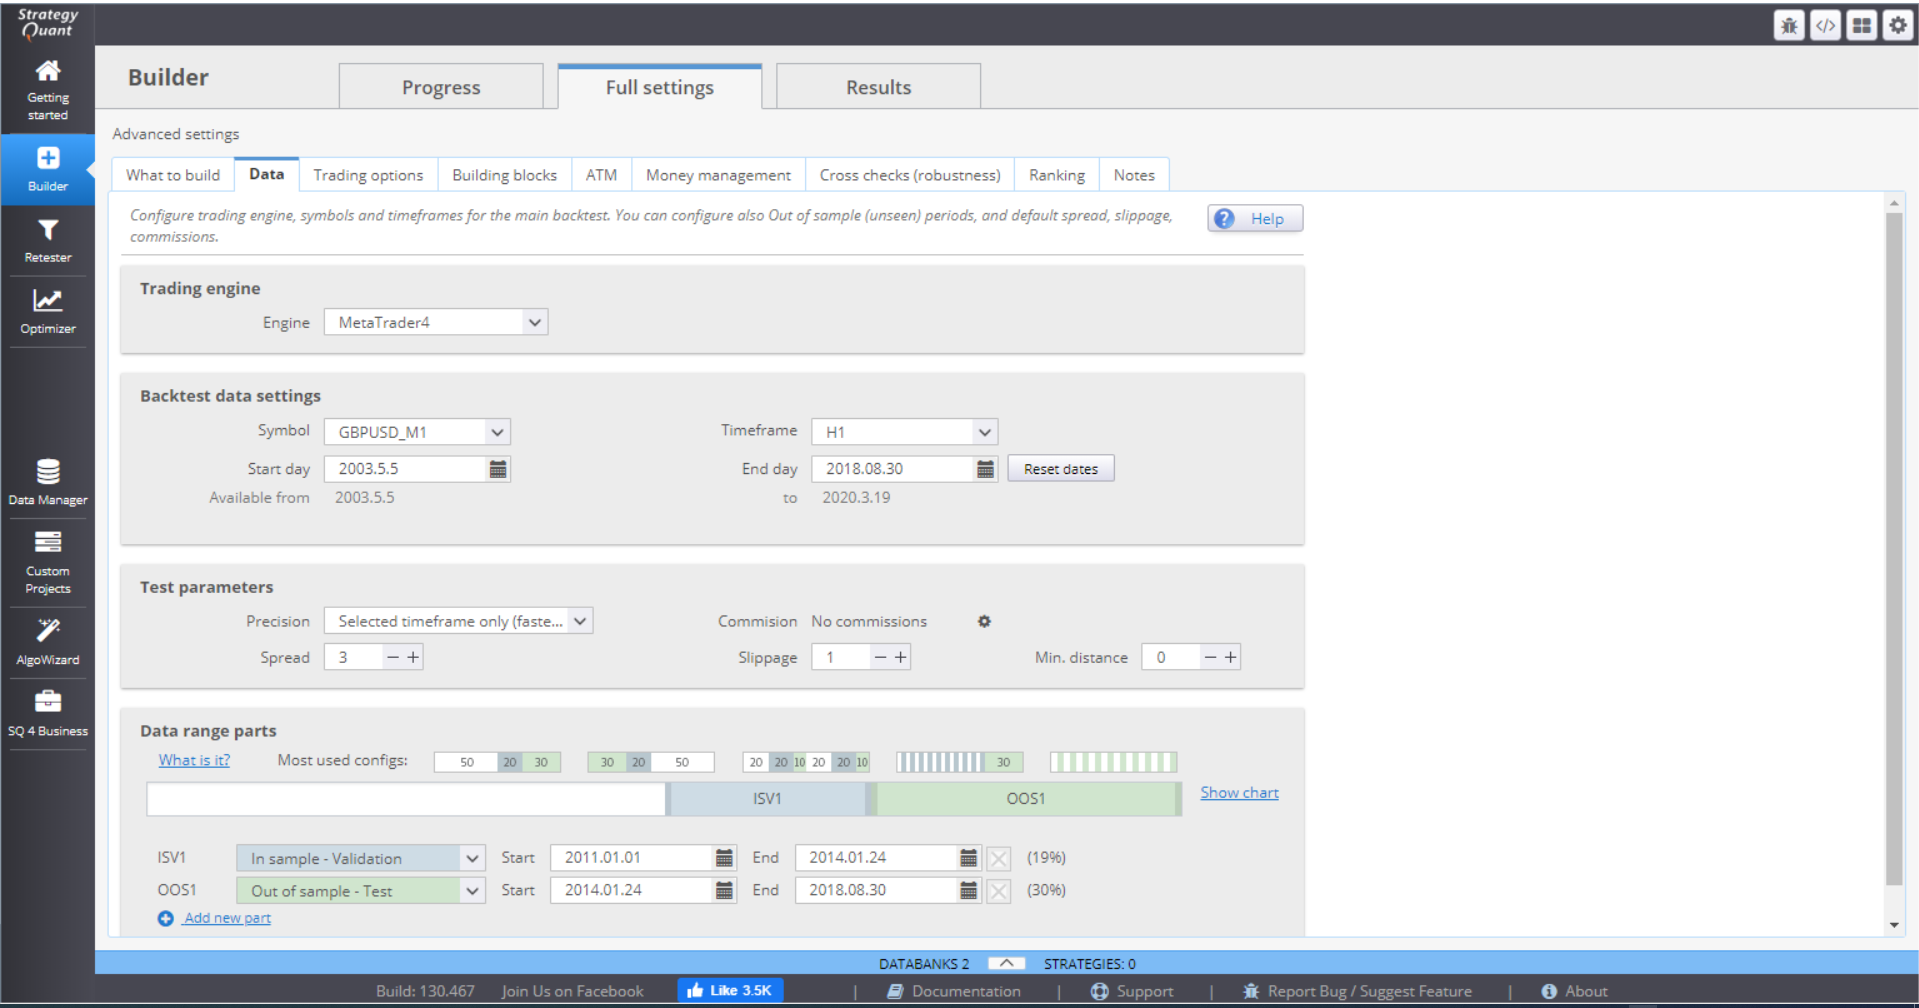
› In Trading engine, you can choose the trading platform that you want to work with.
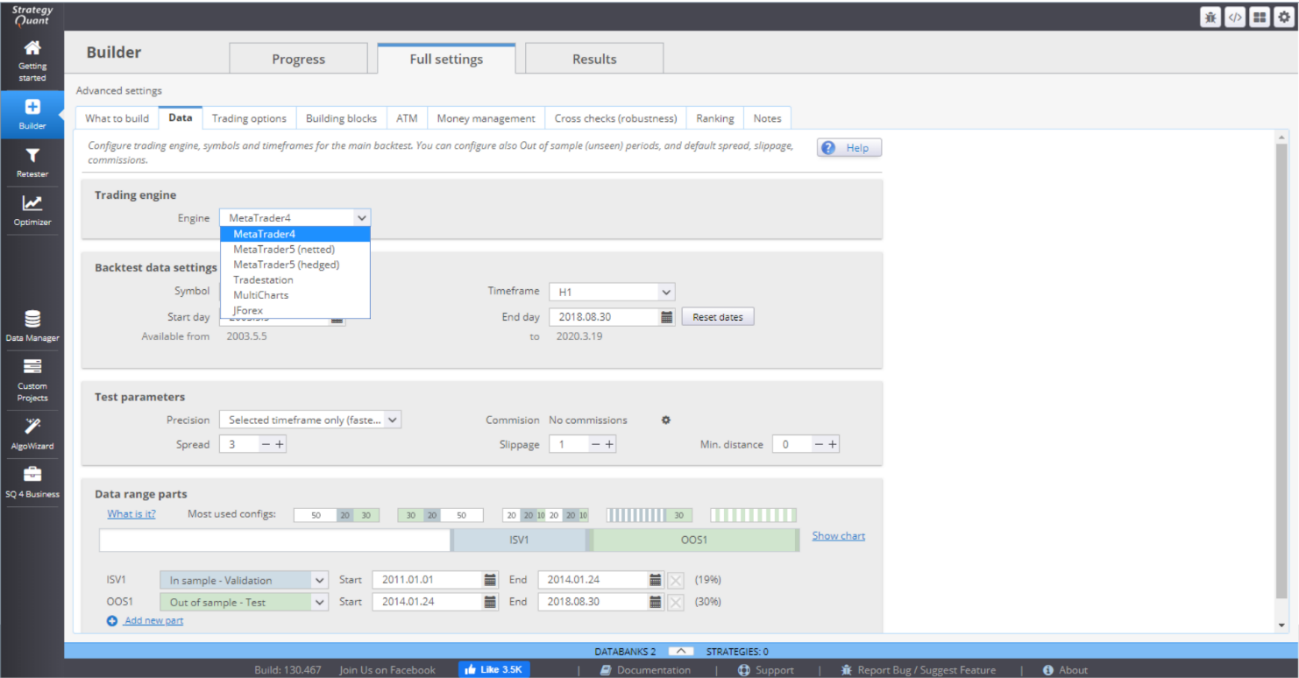
› Backtest data settings allow you to choose symbol, timeframe and time period for the backtests.

If you have chosen Multi-timeframe or Multi-symbol strategies in What to build menu, you have to specify their parameters here.
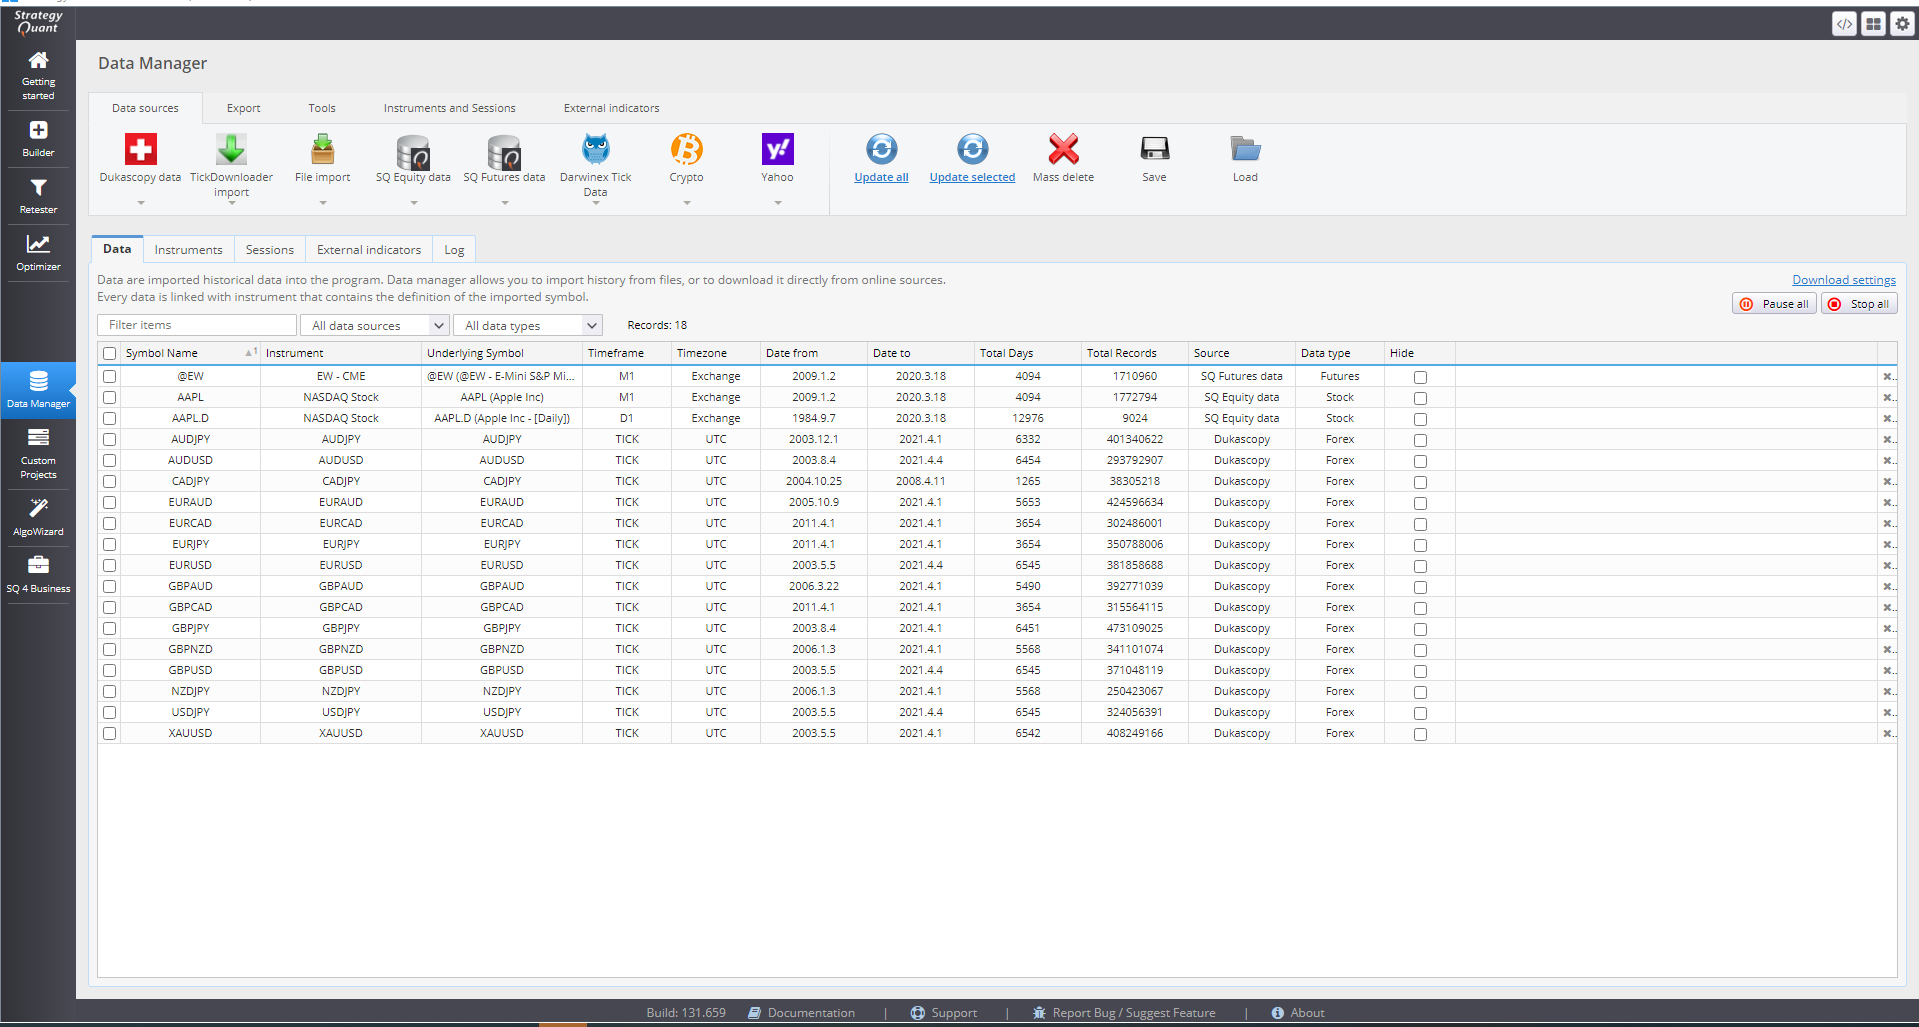
You can download history data from the Data Manager. It will then be available for use in Builder and you will be able to select it for your strategy development.
› Test parameters - here you specify the precision of the simulated data. It generally depends on the order types that have been selected. For market orders it is good enough to use the Selected timeframe, while Limit and Stop orders require more precision.

There are 4 options for setting the Precision:
› Selected timeframe only generates 4 ticks per bar – at Open, Close, High and Low for the period.
› 1 Minute data is more precise. It uses 1-minute data (if available) and generates 4 ticks per minute. This way it simulates price changes within the bar.
› Real tick – custom spread uses real tick data (if available) for the Bid price. It calculates the Ask price based on the spread that you specify.
› Real tick – real spread uses real tick data with real Bid and Ask prices. This is the slowest backtesting method of the four, so it should be used for final verification only.
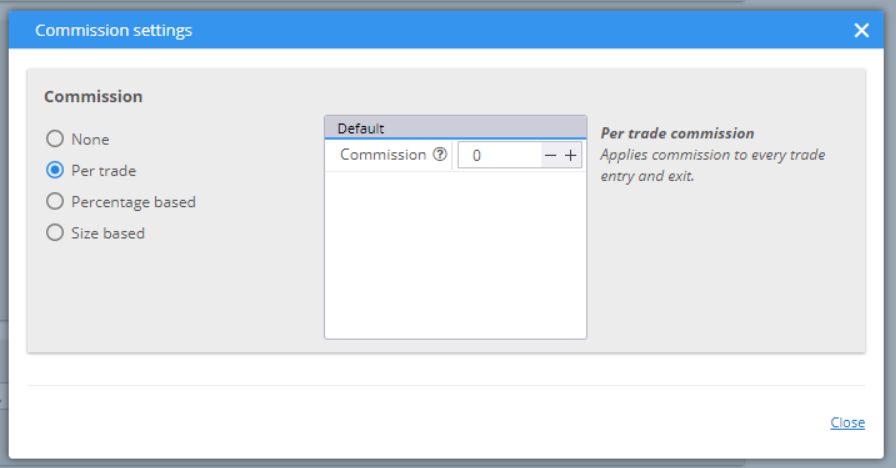
You can choose to set the Commission rate.
The Spread value would be used to calculate the Ask price if you choose Real tick – custom spread for precision method. Slippage adds a specified number of pips to the opening or closing price of your positions. Min.distance is set for your pending orders. Some brokers set limits on the distance from the current price when placing limit or stop orders.
› Data range parts provides the opportunity to split the data set into different parts. You can choose one of the configurations, from the top, or manually structure one of your own.

In Sample Training (IST) is the white part of the history data where the strategies are evolved, using Genetic evolution. Their fitness is calculated here which determines their rank (the higher the value, the better the strategy). The best candidates have the highest probability to be chosen for crossing or mutation processes. This ensures that the next generation is better than the previous.
In Sample Validation (ISV) part determines whether the strategy still holds its fitness. This is where the Restart of the genetic process is done, if the fitness stagnates.
Out of Sample (OOS) is a part of the history data that is unknown to the evolution process. It simulates real trading conditions for the strategies.
No Trade is a part where the strategy will not trade. This could be used to skip sections with low volatility, for example.
You can change the arrangement and the duration of each period. You can add new periods, or remove unnecessary ones. The optimal option is to split the data into 3 parts – IST, ISV and OOS.

TRADING OPTIONS
In Build and Trading options you can specify rules for the opening and closing of trades.
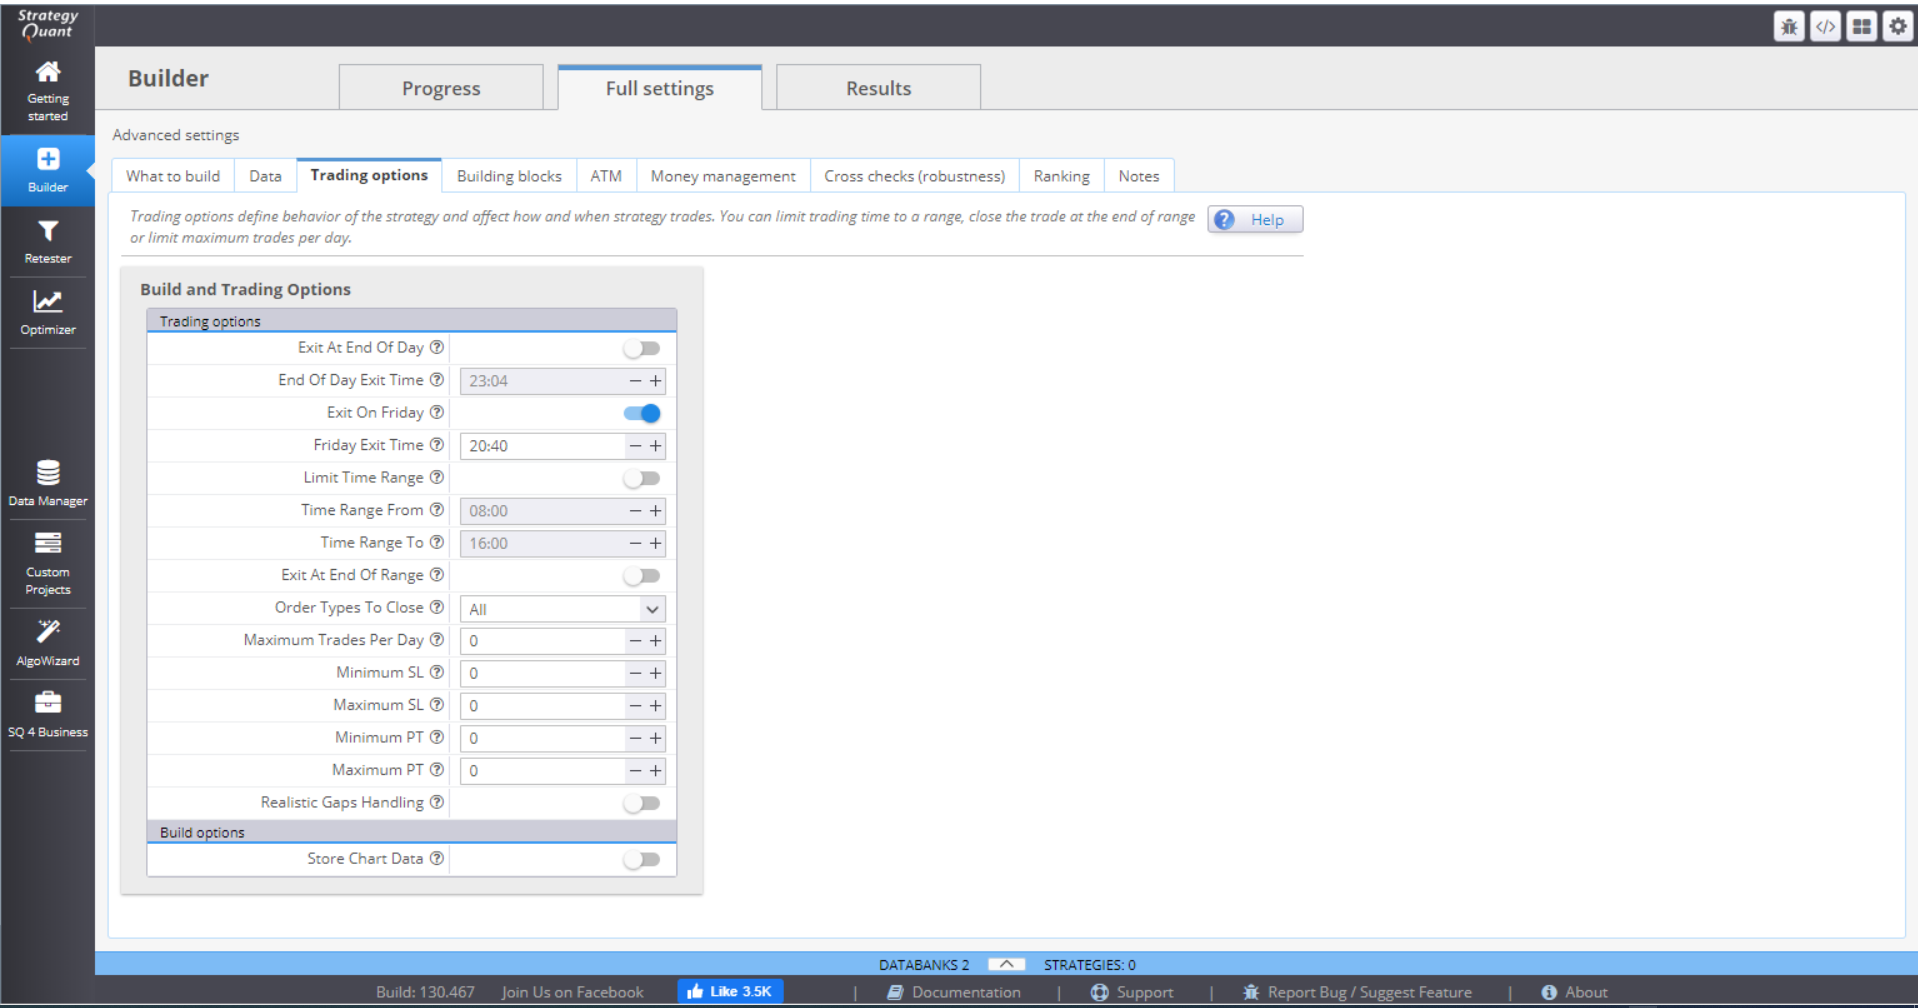
You can choose to exit all positions at the end of the day, or on Friday, and specify the exact time.
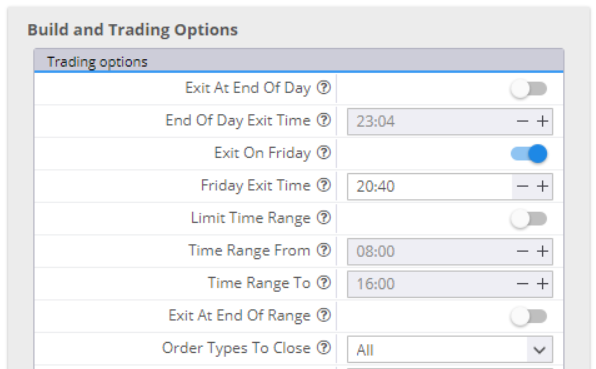
If you switch Limit Time Range on and fill in the range, the strategy will open trades in this time period only. You can choose to close the open positions at the End of the Range. You have the option to close all positions, live trades only or pending trades only. If you leave that inactive, the strategy will leave your positions open.
If you want to, you can limit the maximum number of trades per day.
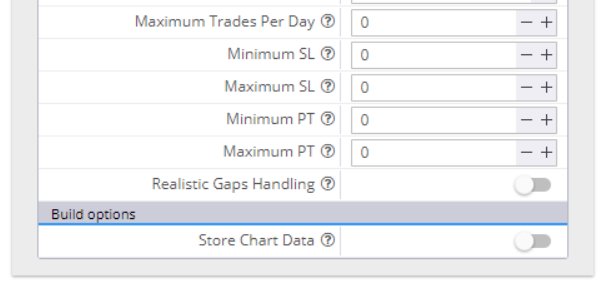
You can set minimum and maximum values for the Stop Loss and Take Profit orders. In this case, if the random generating process selects values beyond the range, they will be automatically cut to fit in. Zero in the value field means random value.
Realistic Gaps Handling is a way to handle gaps more realistically than the MetaTrader4 backtester. The latter would fill a pending order at its limit/stop price, which is not accurate. In real trading the order will fill at a price level after the gap.
If you choose to Store Chart Data, you will have complete chart data of your backtest, with all the indicators and all the trades on it.
BUILDING BLOCKS
This section contains all the building blocks available in StrategyQuant.
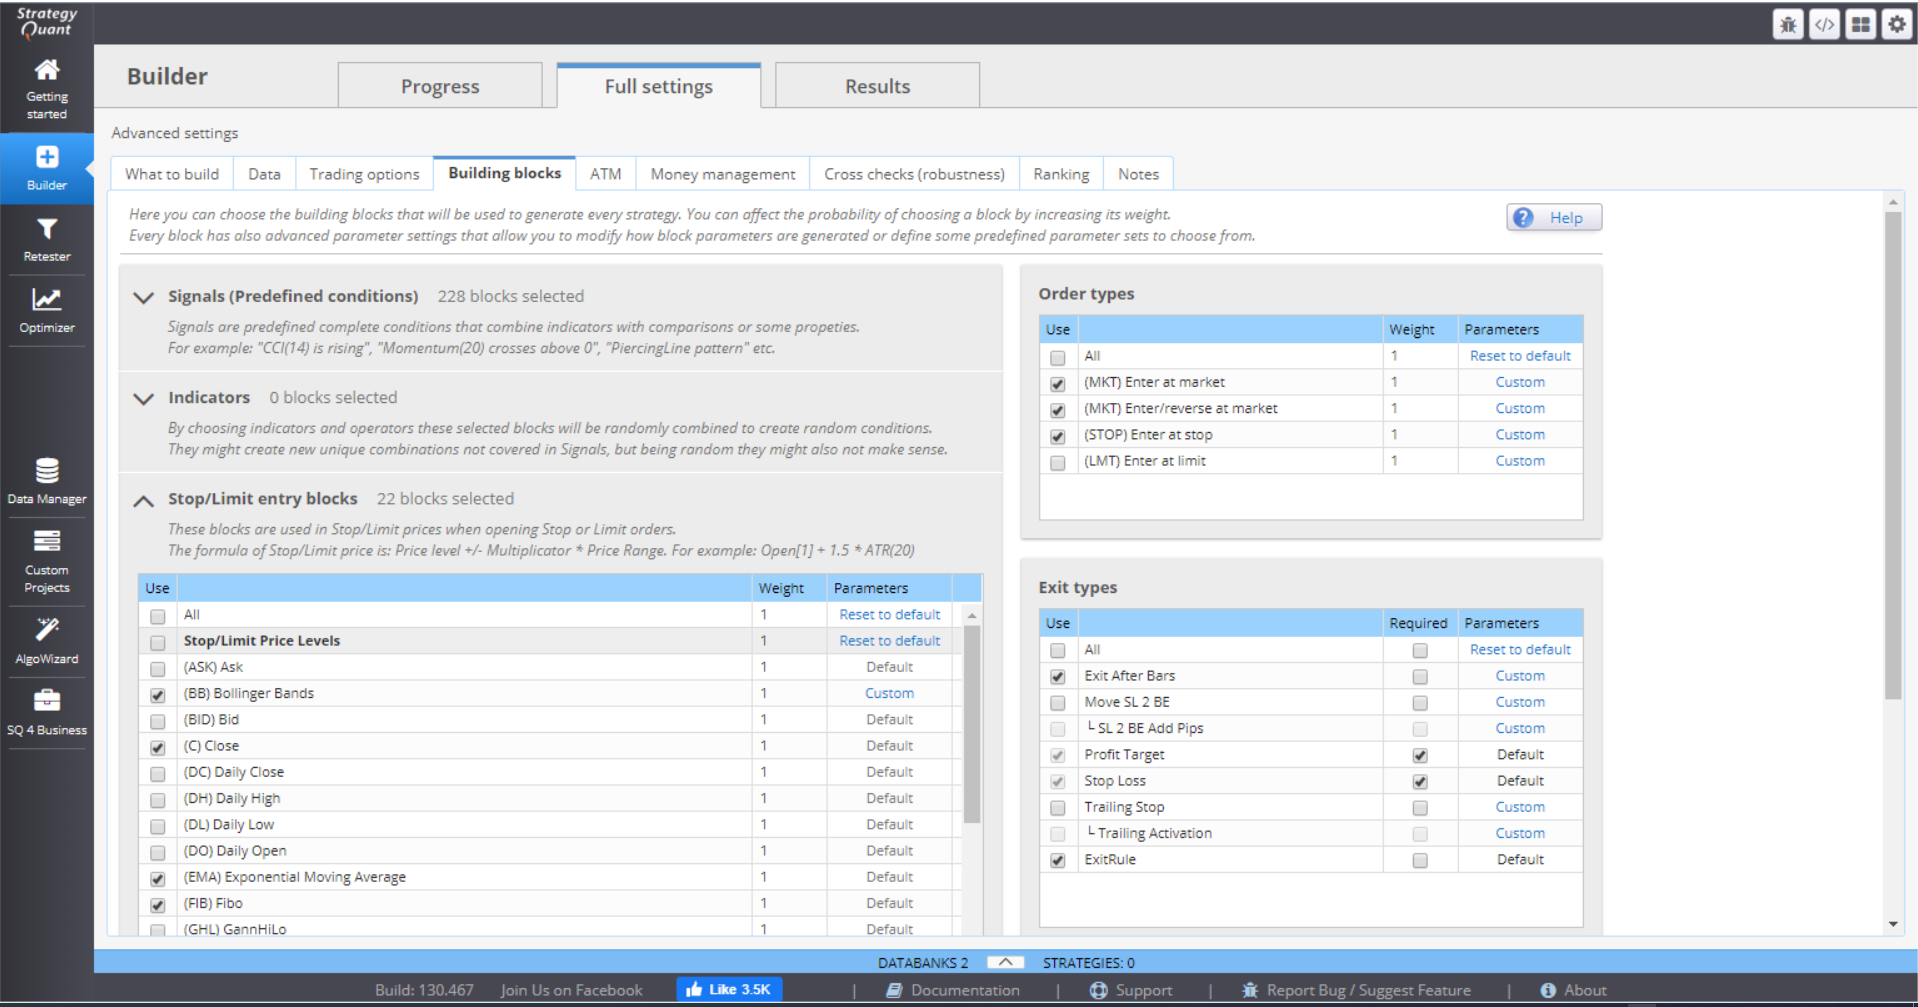
› Signals (Predefined conditions)
This holds templates for different signal rules. You can choose which ones you want to use as building blocks for your strategy generation. You can decide to put more weight to some of the rules by accordingly setting a larger number. This way this signal will be more likely used, than the other similar signals.

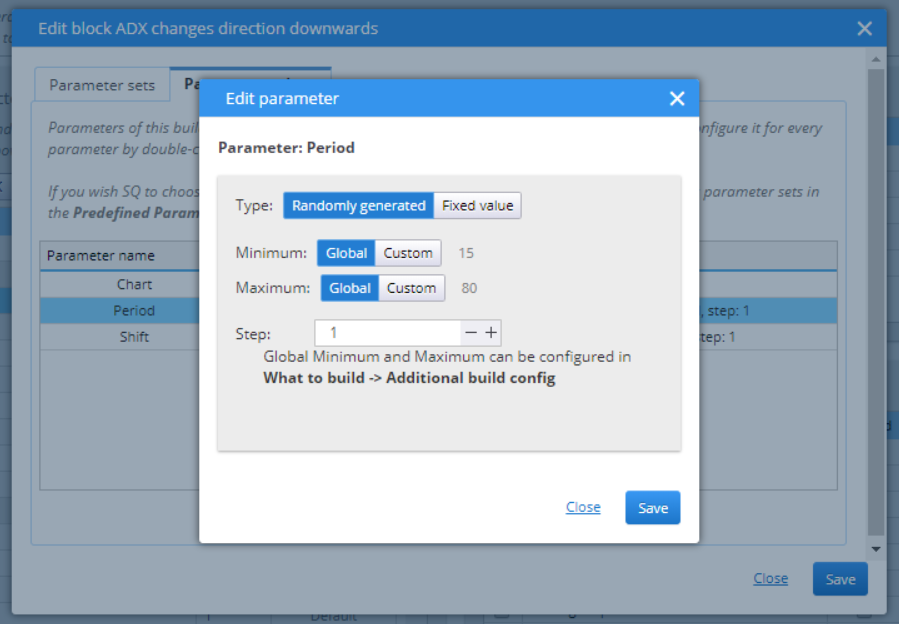
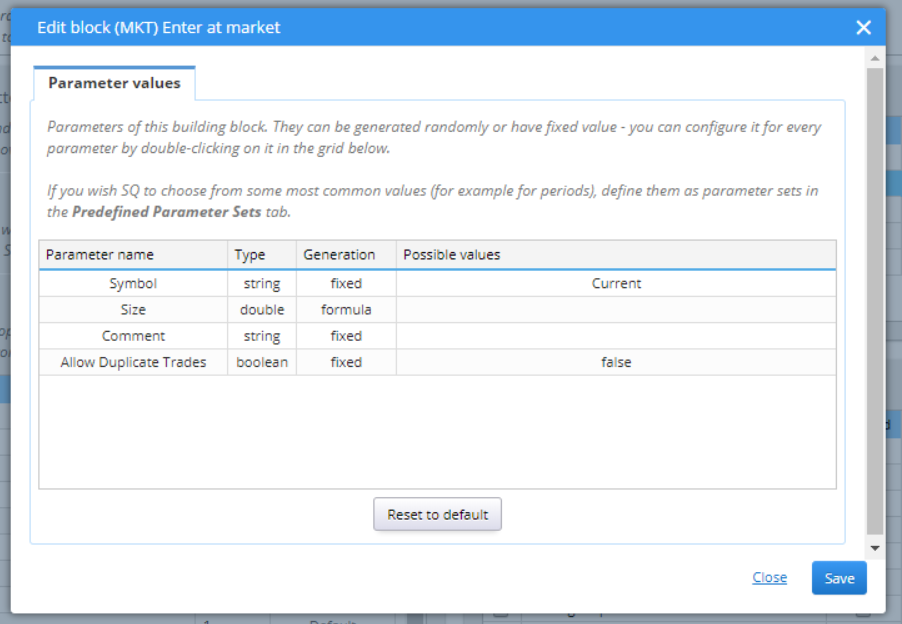
All parameters for the signals can be customized. This pop-up window shows when you click the Parameters value.
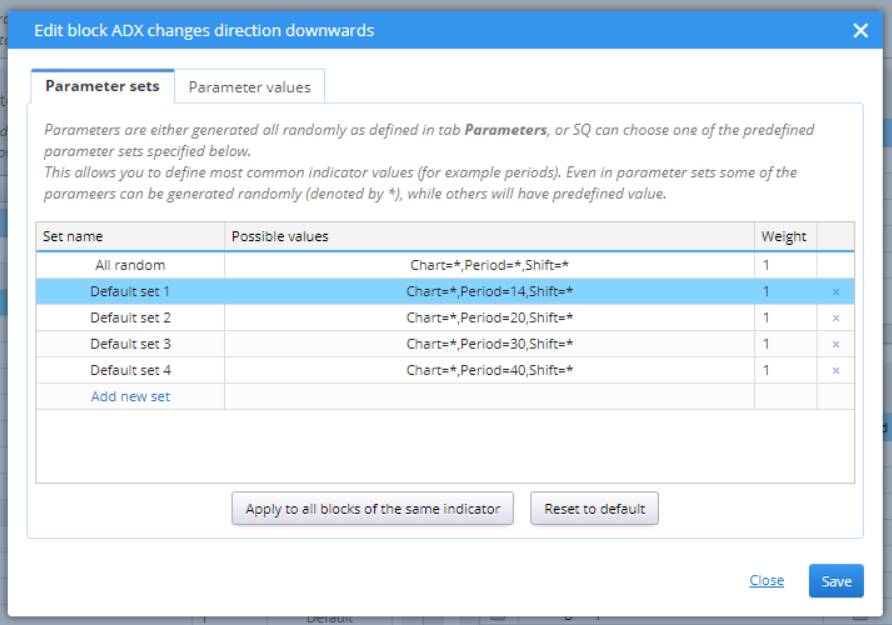
You can choose to put more weight to some of the conditions, add new ones, delete some of them. You can change the possible values by double-clicking on the Possible values section.
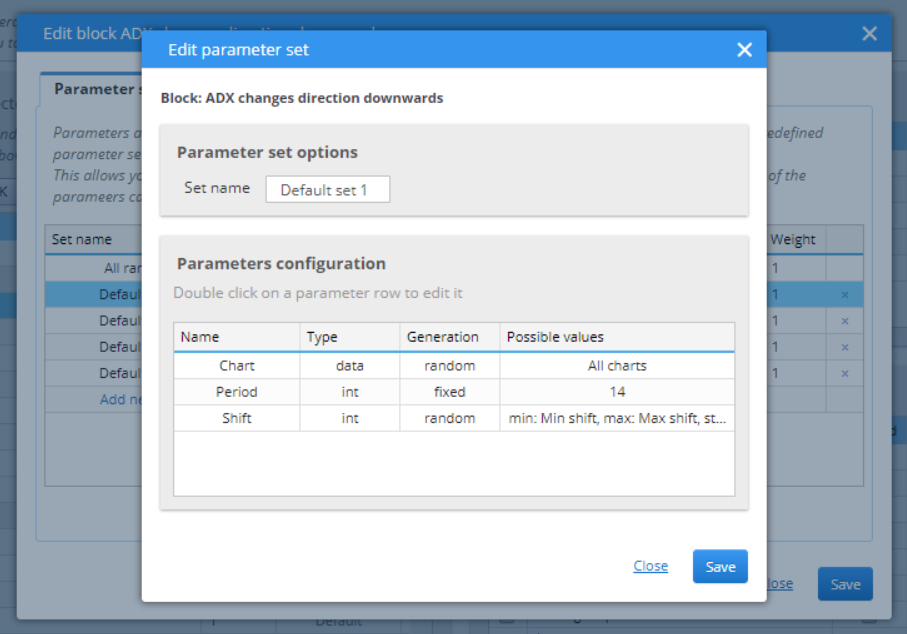
› Indicators
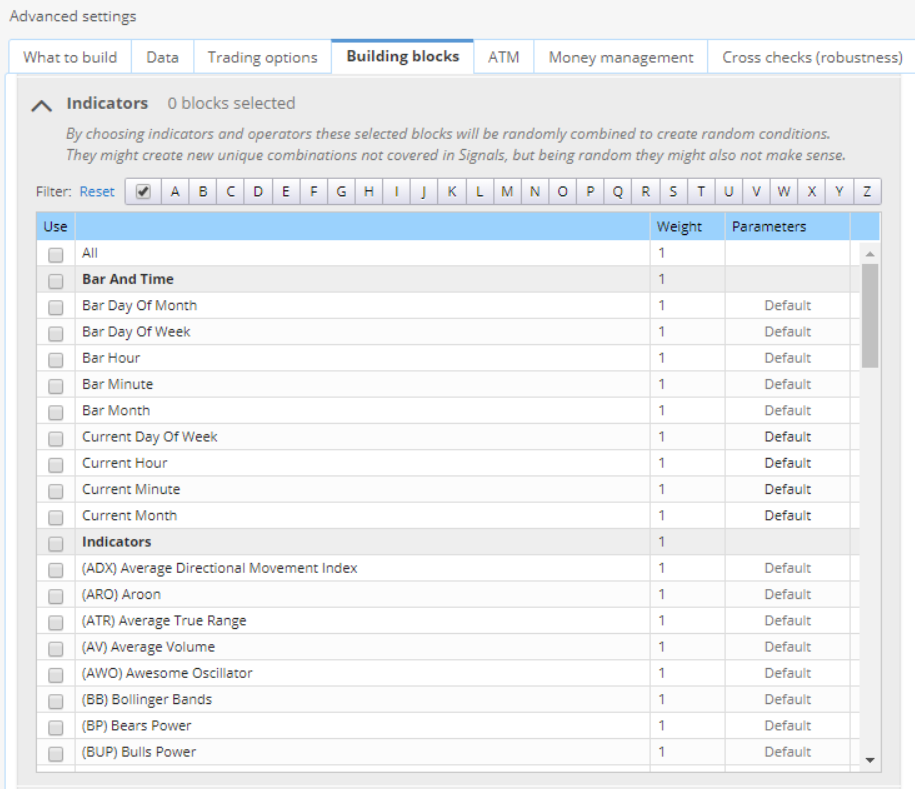
Pick the indicators that would be included in the development of the strategies in Builder. The possibilities here as the same as with signals.
› Stop/Limit entry blocks
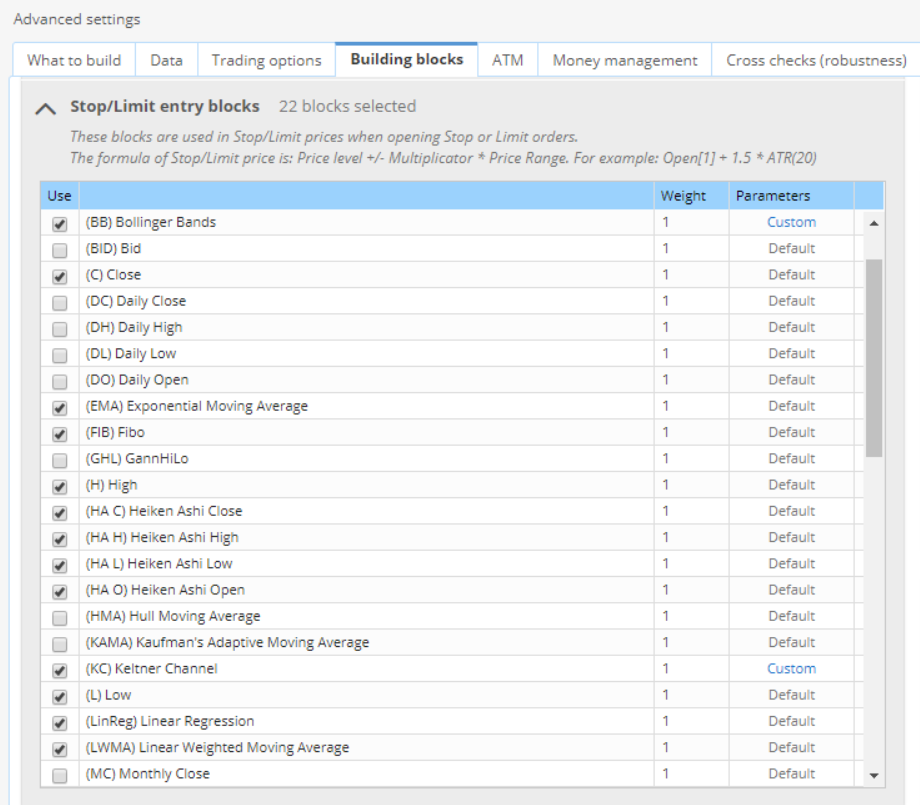
These are the blocks used with the pending orders.
› Order types
This section lets you choose the order types that you want the strategies to work with.
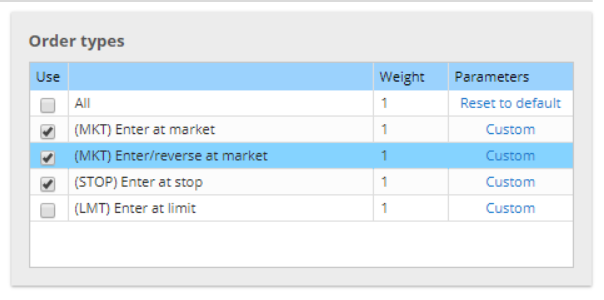
You can choose to put more weight to some of them, or change their parameters.
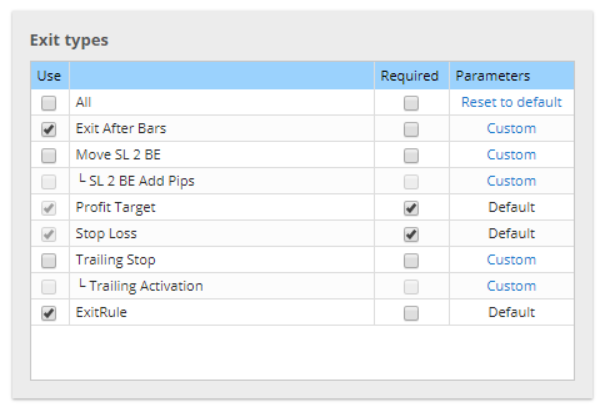
› Exit types
Provides a list of possible exit rules to be included in the random generation of strategies.
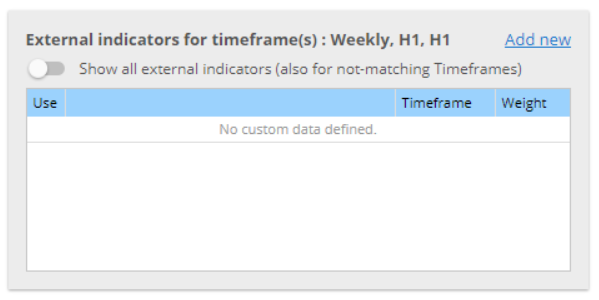
› External indicators
You can import custom indicators to StrategyQuant. Note that they will only be valid for the selected timeframe.
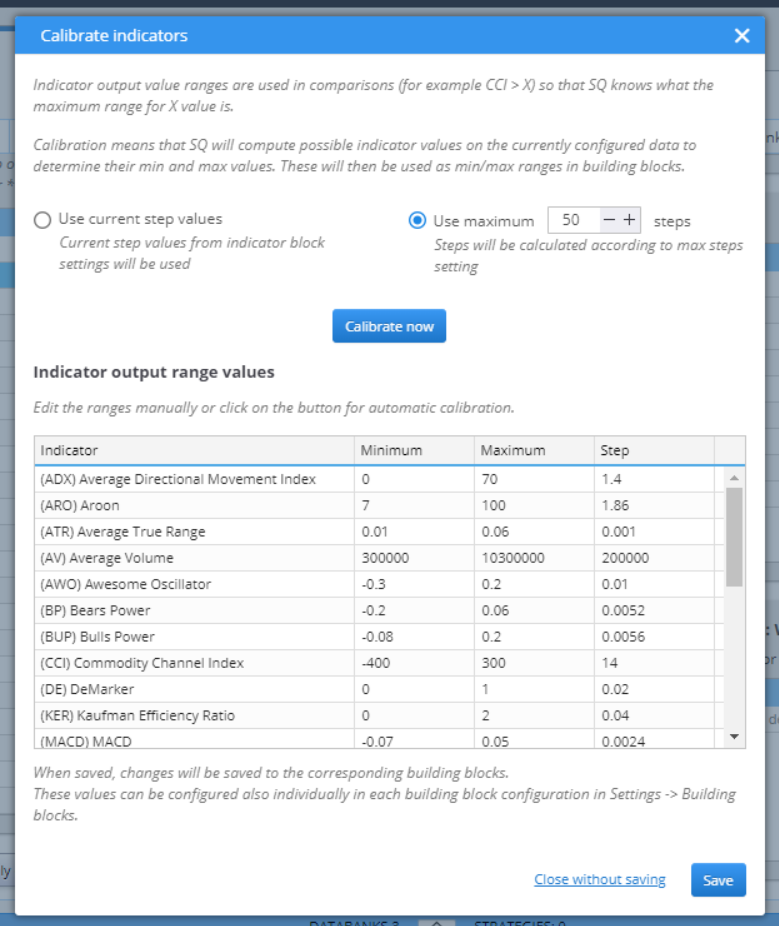
› Calibrate indicators
This computes the possible indicators value based on the configured data and determines the range (minimum and maximum values) for the indicators. You can randomly choose or add blocks. There is the option to save your building blocks configuration to a file, or to load such a file.

ATM
The advanced Trading Management allows you to configure multiple exits to your open positions. Using this option will disable all other exit options – Profit Target, Trailing Stop, etc. It will only use the Stop Loss settings and the ones configured here, in ATM.
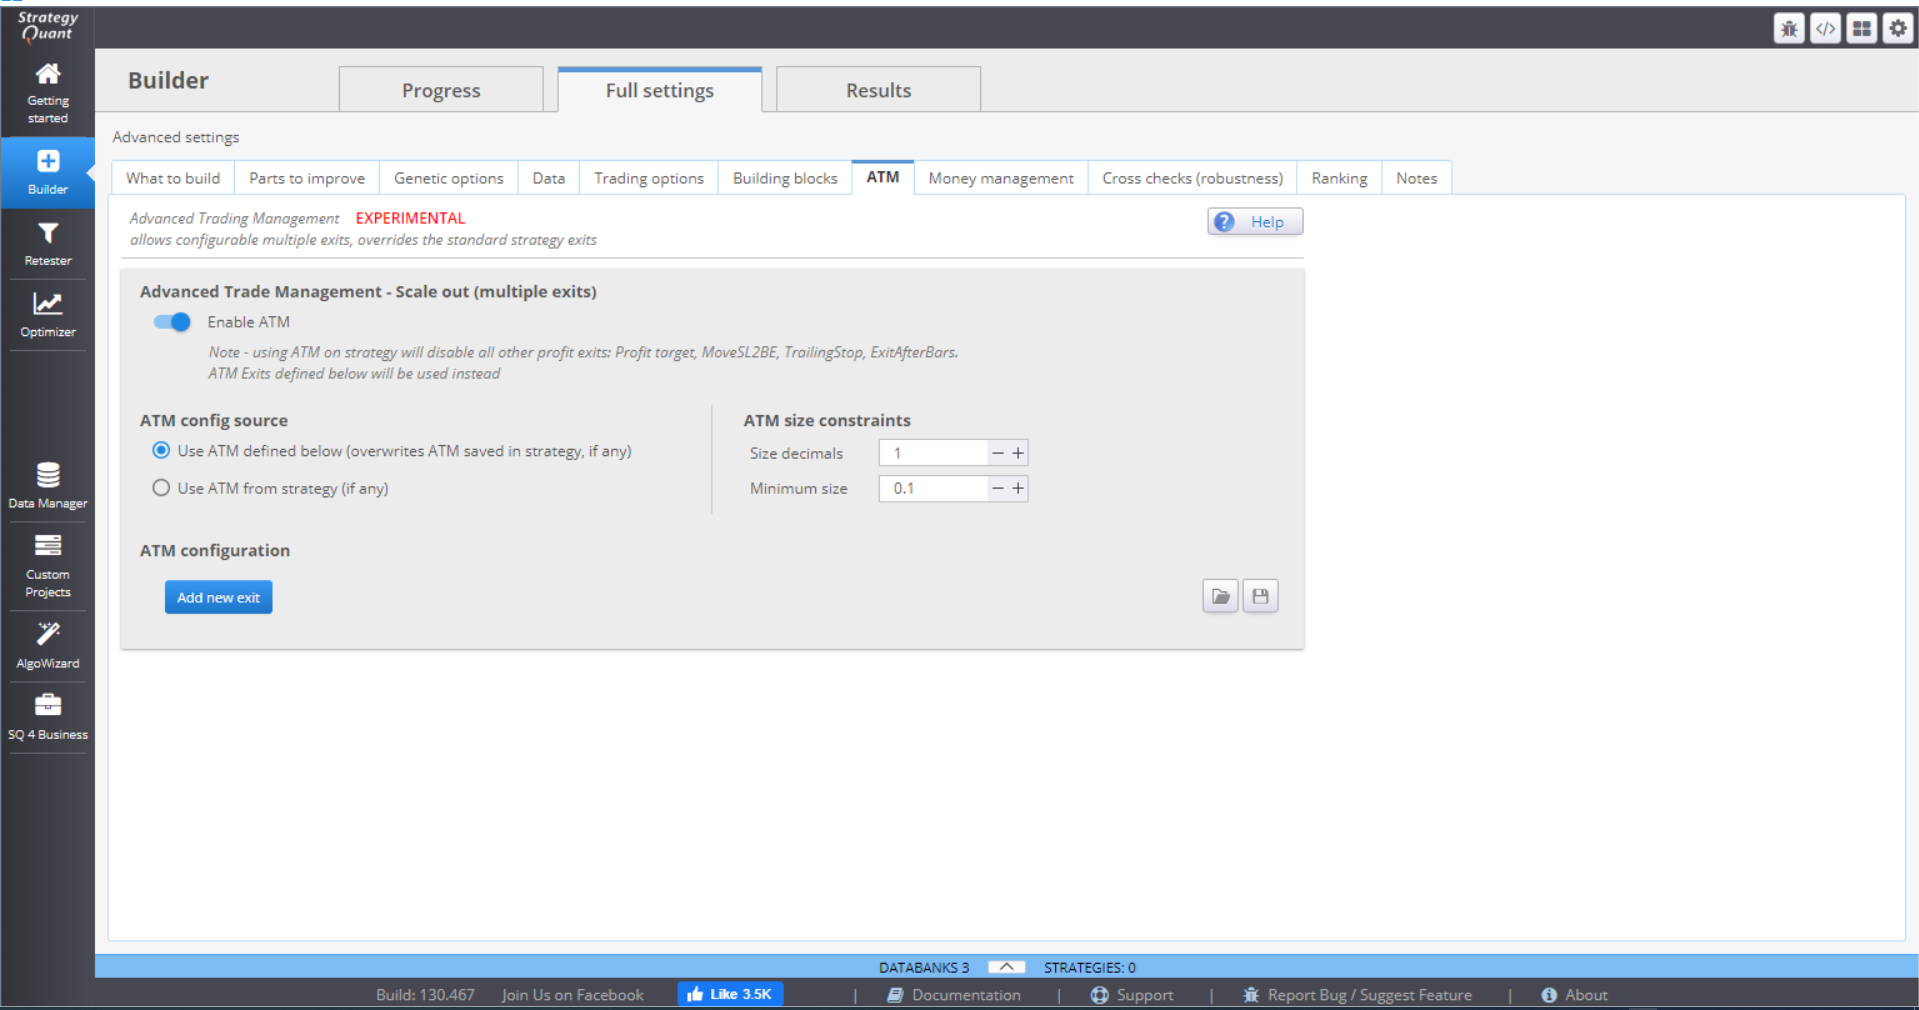
The idea is to close one part of the trade quickly after the profit is enough to cover the costs and the risk. The other part of the trade is left to reach further profit target(s).
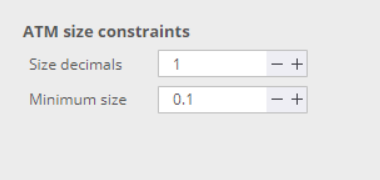
ATM size constrains gives some rules to ATM when computing the position parts. Size decimals gives instructions how to round the parts size. Minimum size is the smallest acceptable size of the parts.
You then configure the rules by clicking the Add new exit button.
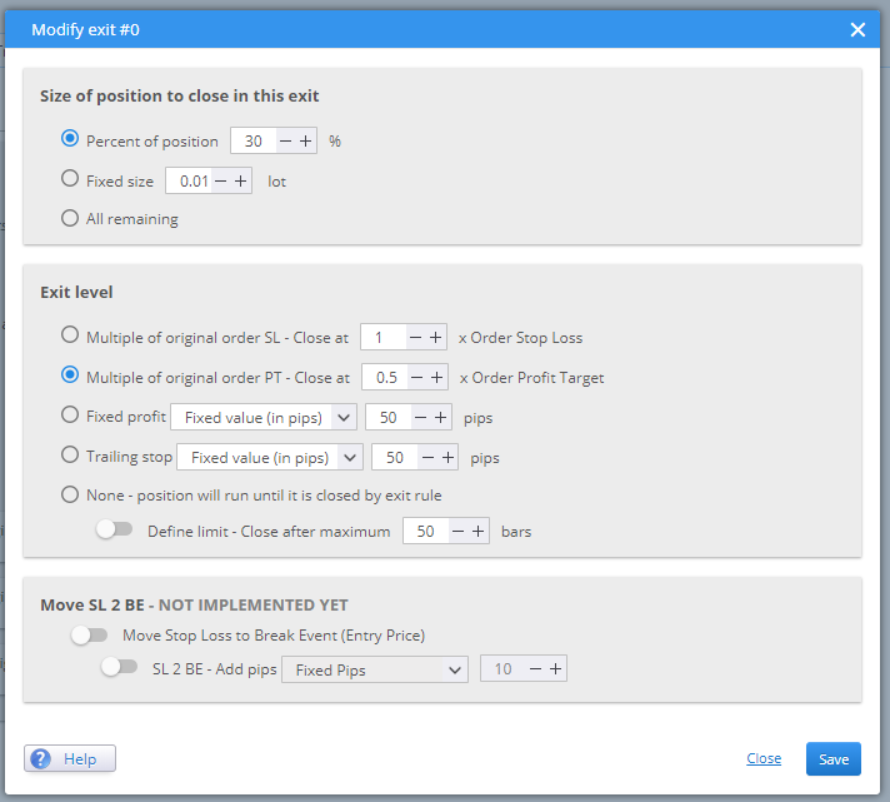
Size of position to close in this exit gives you three options. Choose whether you want to compute the parts using a percentage or a fixed size. All remaining is suitable for setting rules for the last part of the position.
Exit level is where you define when you want this part of the position to be closed. You can set it to be dependent on the SL or TP. Or choose it to be a fixed value. The last option is to close the part after a given number of bars.
When you configure the rules, they are saved and applied to your strategy.

MONEY MANAGEMENT
In this menu you configure the initial capital and the position sizing method.
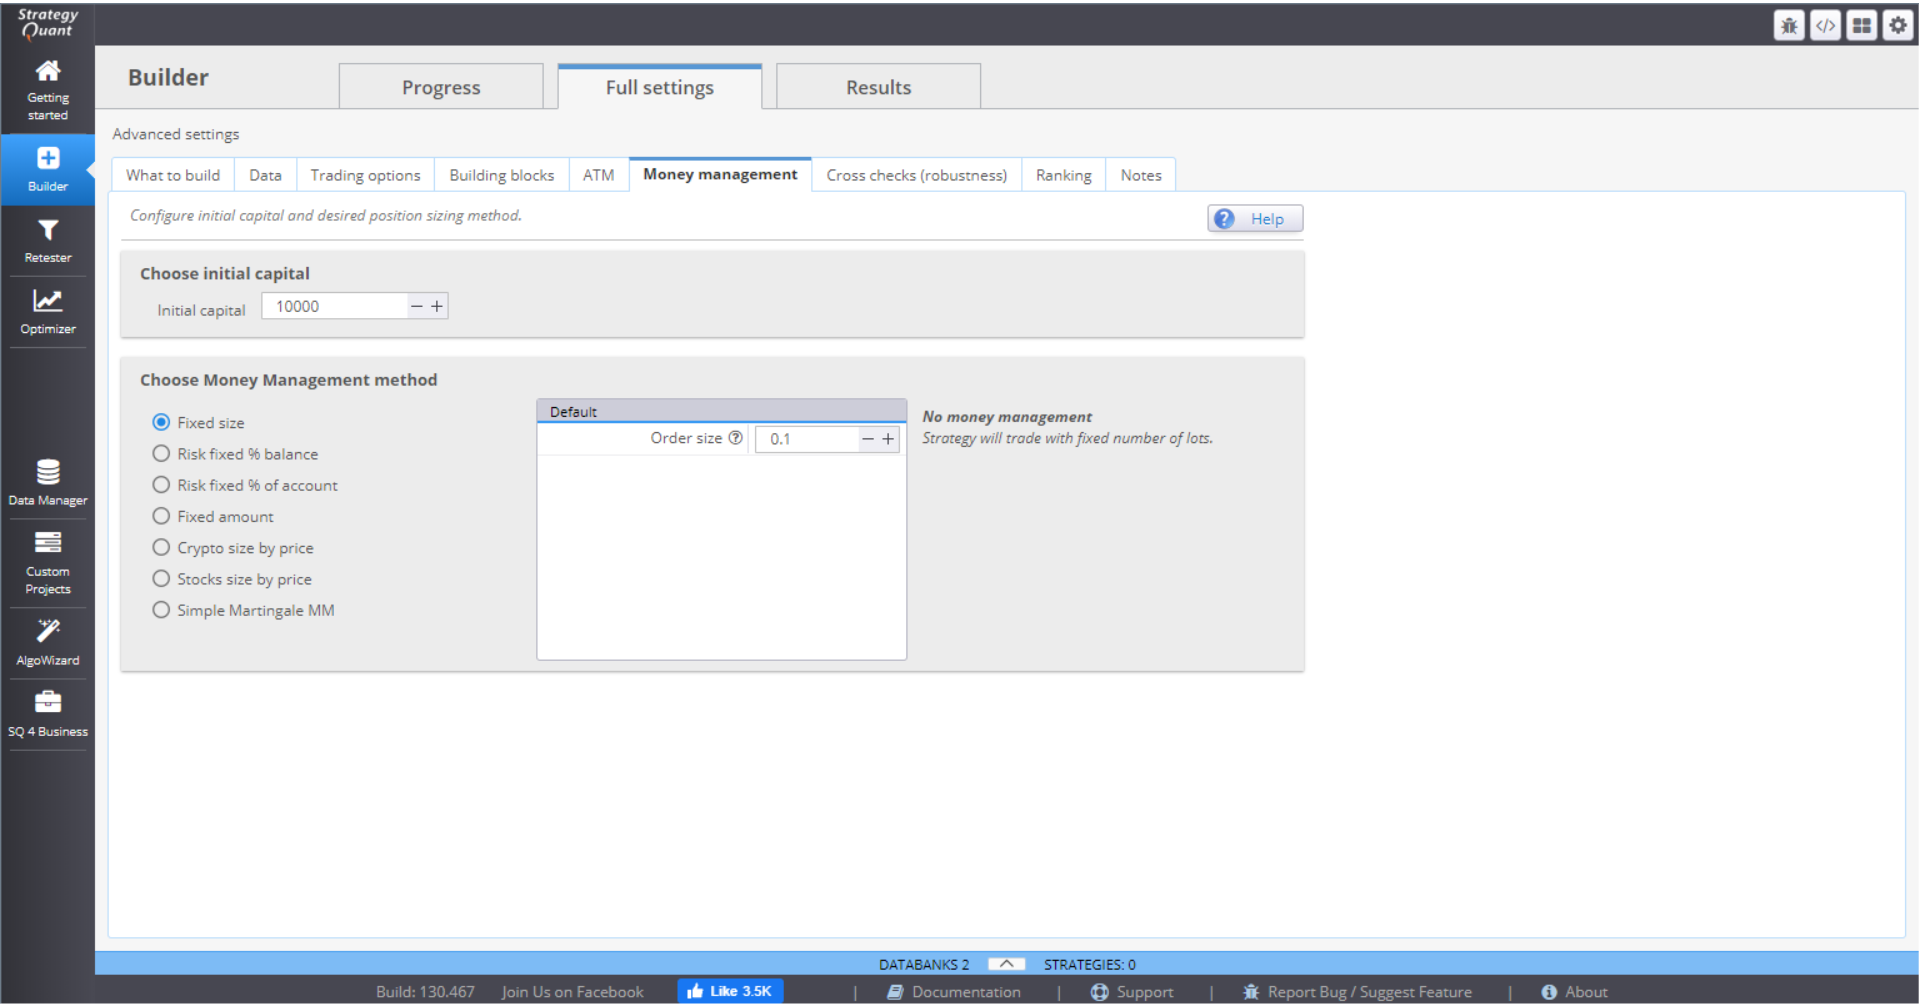
There are 7 MM methods to choose from:
⇒ Fixed size – the positions are opened using a fixed number of lots. This simple method is good when generating new strategies, as it gives you a clear overview of its real performance.
⇒ Fixed % of balance – this method will risk a certain percentage of your balance, meaning the money that you have in your account without including the profit/loss from open positions.
⇒ Fixed % of account – this will risk a certain percentage of your equity. The difference with the previous method is that the position size is calculated on balance, including profit/loss from open positions. This makes the method extremely sensitive to account changes, which is very effective money management.
⇒ Fixed amount – this method risks a fixed amount every time. It is a good way to test a strategy with Stop Loss, based on volatility (ATR), or when you want to compare strategies with different SLs.
⇒ Crypto size by price – this method is designed for crypto trading. You need to specify the exact number of characters after the decimal point that will be used. The initial capital is used by default, but you can set the method to use the account balance.
⇒ Stock size by price – the method is designed for trading stocks. Like the crypto method, the initial capital is used by default, but you can choose to use the account balance.
⇒ Simple Martingale MM – this method starts from a fixed size (in lots) and increases the position size by a set multiplier after each loss. The size is reset to starting point when the trade is closed for profit, or when the size exceeds a defined maximum size (in lots). There is an option to use separate logic for buy and sell orders.
CROSS CHECKS (ROBUSTNESS)
You can set multiple cross checks to test how different small changes will influence the strategies performance. They are performed after the initial filters so that a “testing funnel” is formed and poor performing strategies are removed and not saved to Databank.
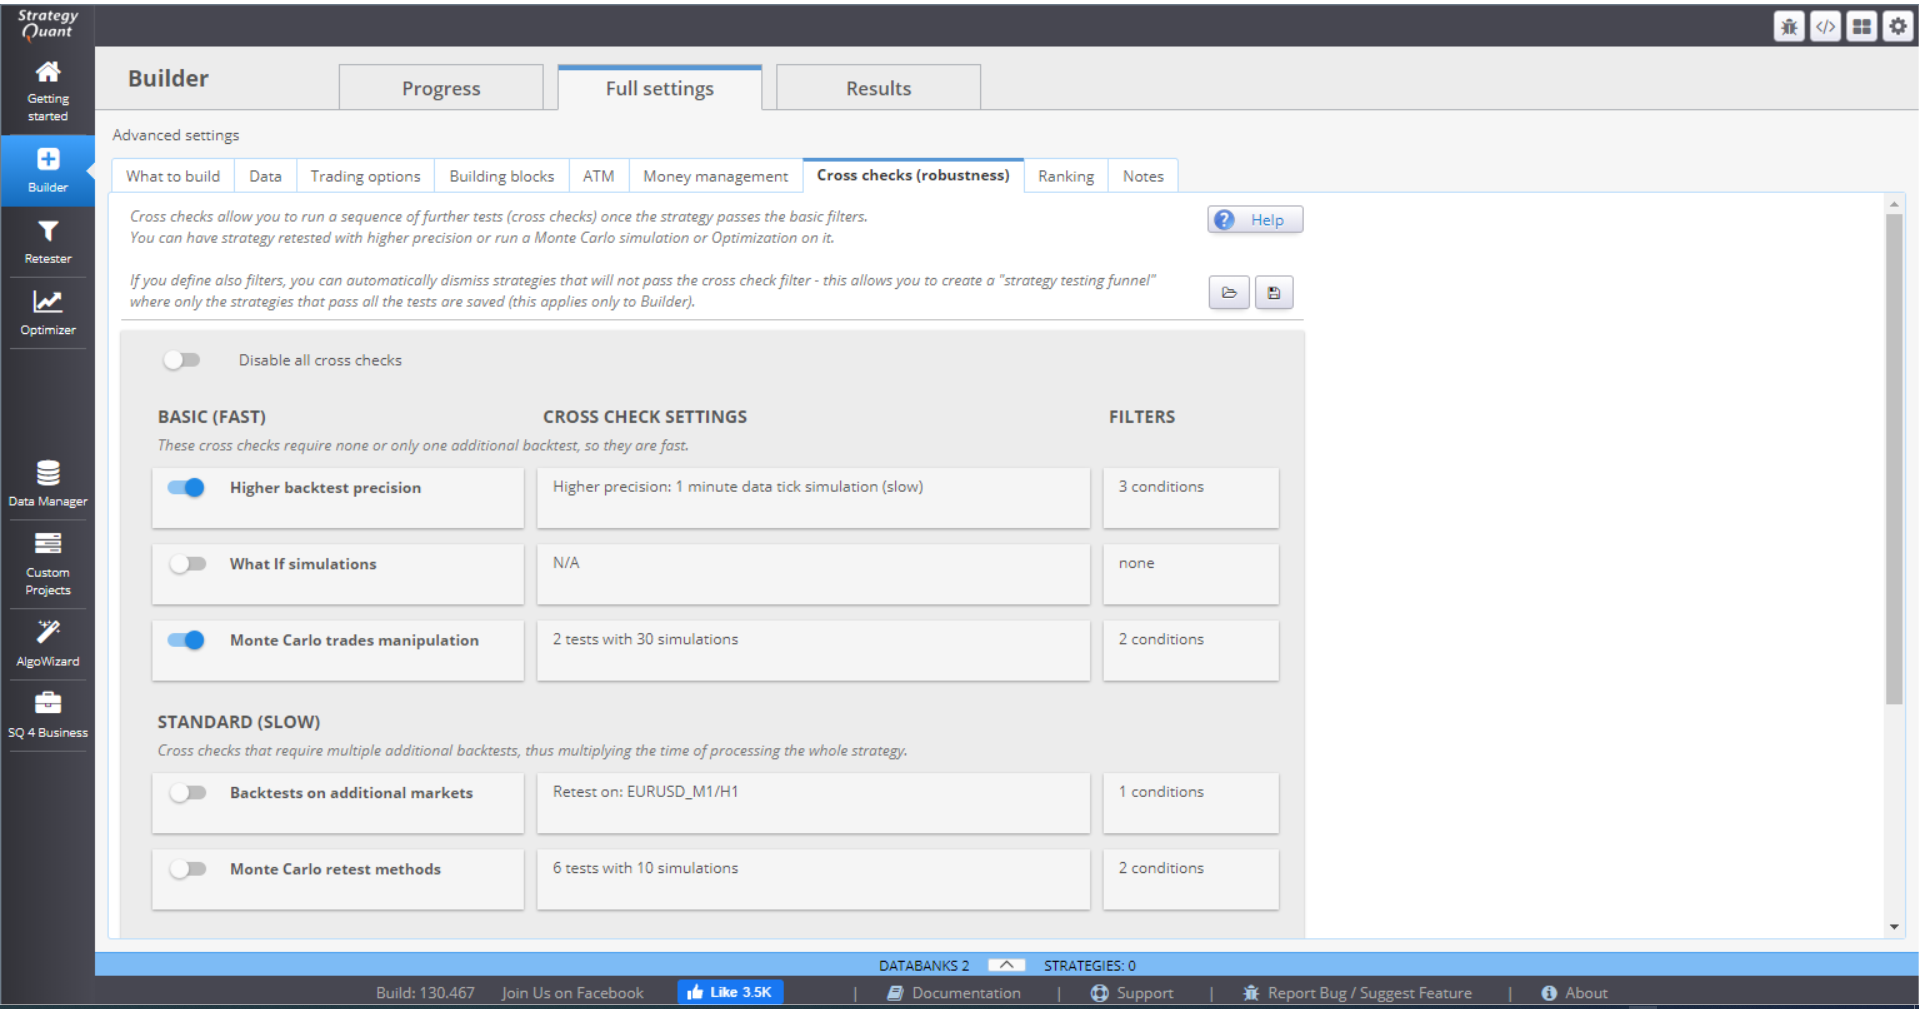
Setting too many or too complex robustness test in Builder doesn’t make much sense. It is very time consuming. It is much better to set these additional test in Retester. Check out the details about Cross checks in the Retester step-by-step guide.
RANKINGS & FILTERING
After the strategies are backtested they are given a rank, depending on their results. This rank is a number between 0 and 1, and is a representation of the strategy’s fitness (quality), or how well it performed, according to predefined criteria.
This section is where you define how the strategies are rated. You can also configure filters to further evaluate the strategies before they are saved in the databank.
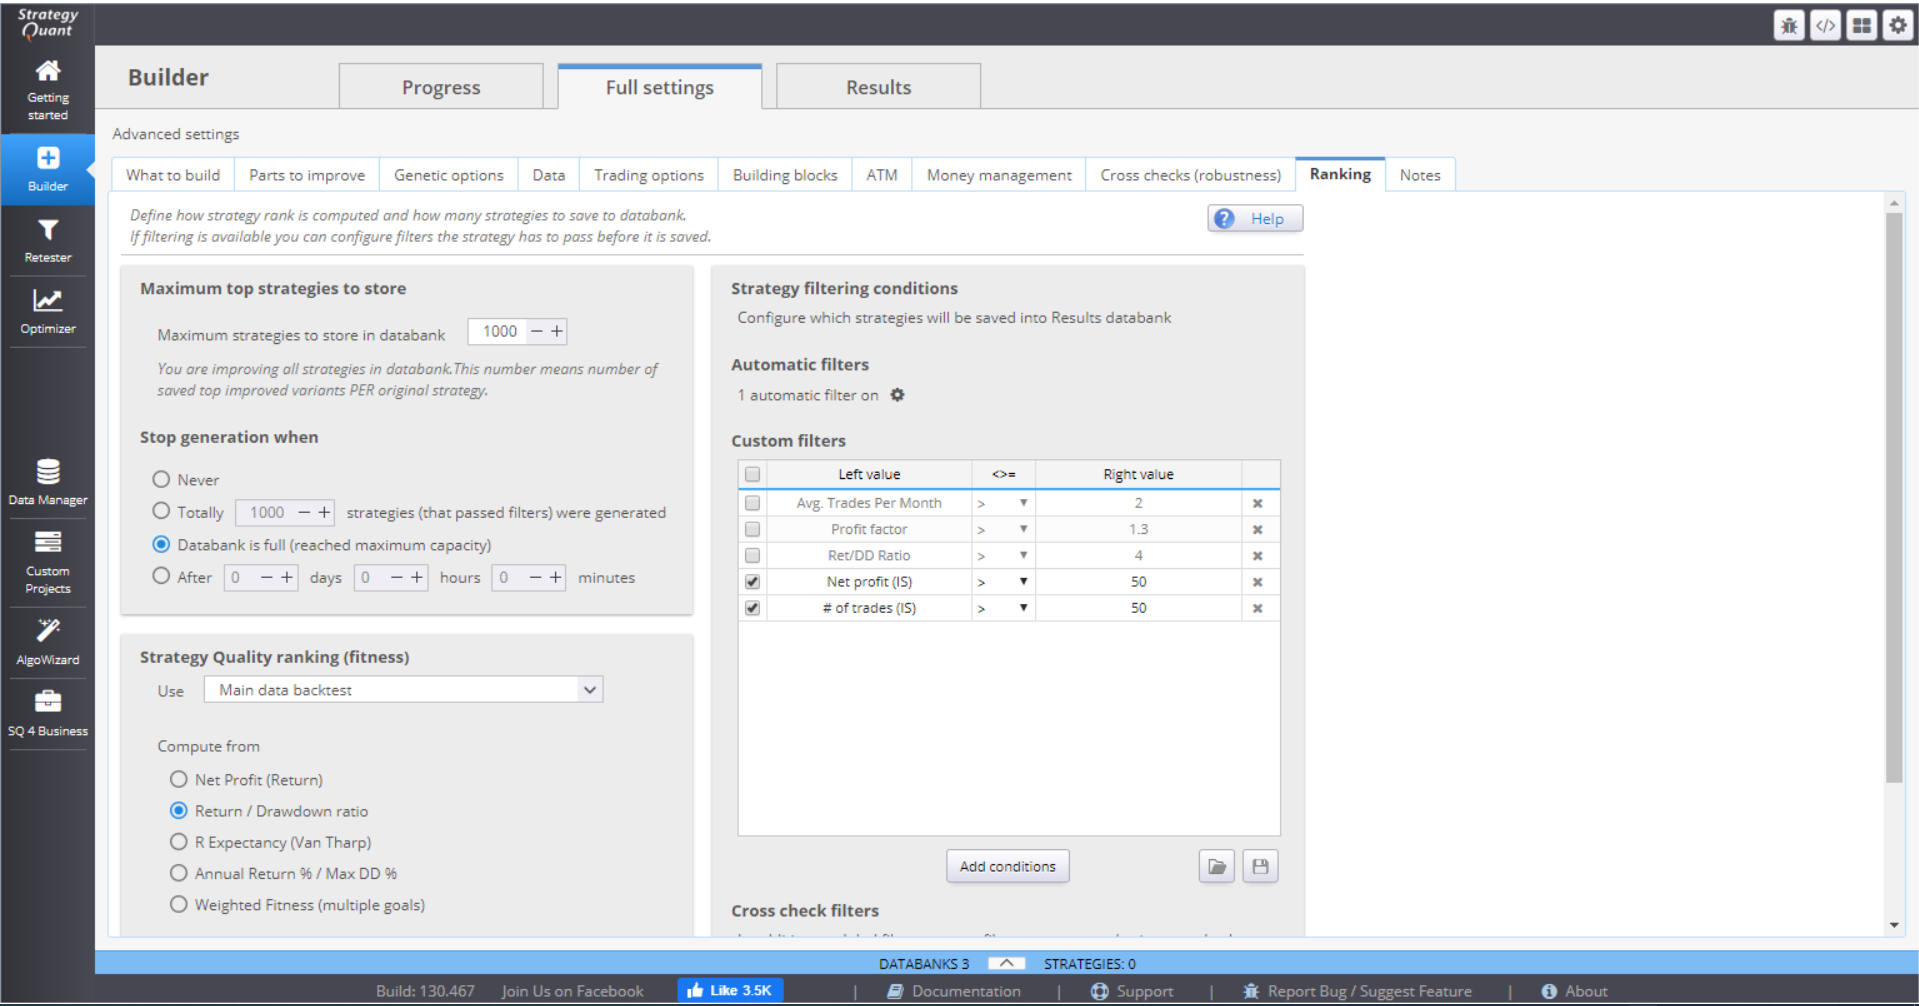
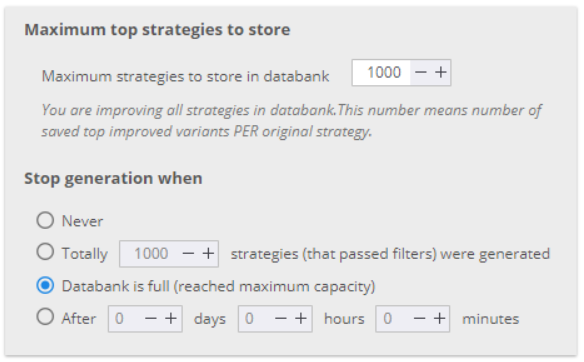
In the first section of the menu you can set the maximum number of strategies that you want saved in the databank and a rule for stopping the generation of more strategies.
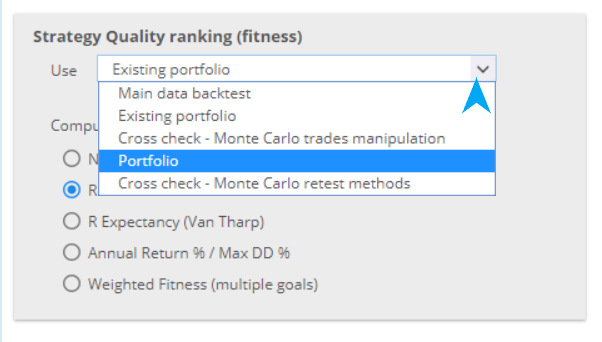
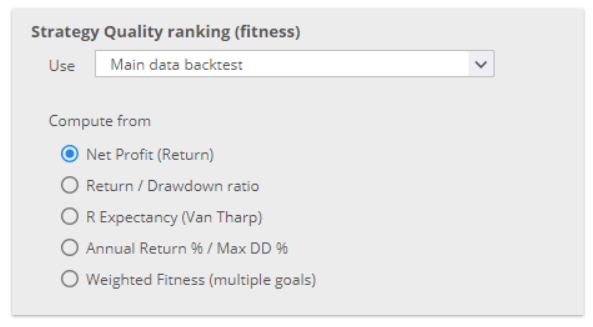
You can choose the data from which to compute the fitness. If you have selected multi-TF or multi-symbol strategies, it is best to rank them based on the whole portfolio, rather than the main data.
Then you can select the criteria to use for the ranking. You may choose one of the default computations.
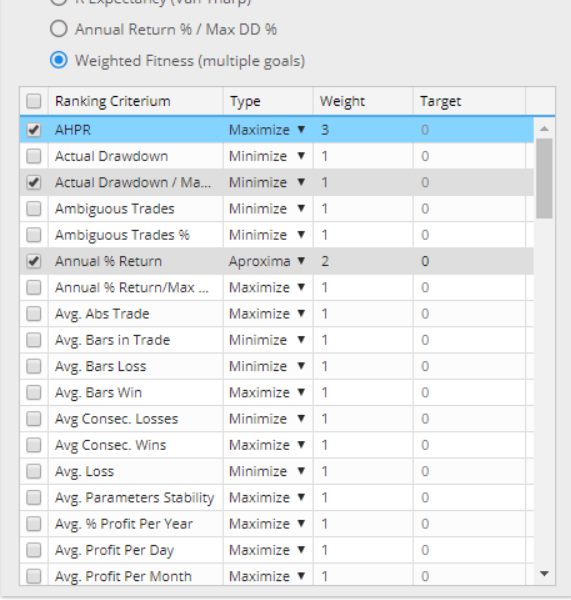
Or, you can configure custom rules. The options here are flexible and you can set the rules in a variety of ways.
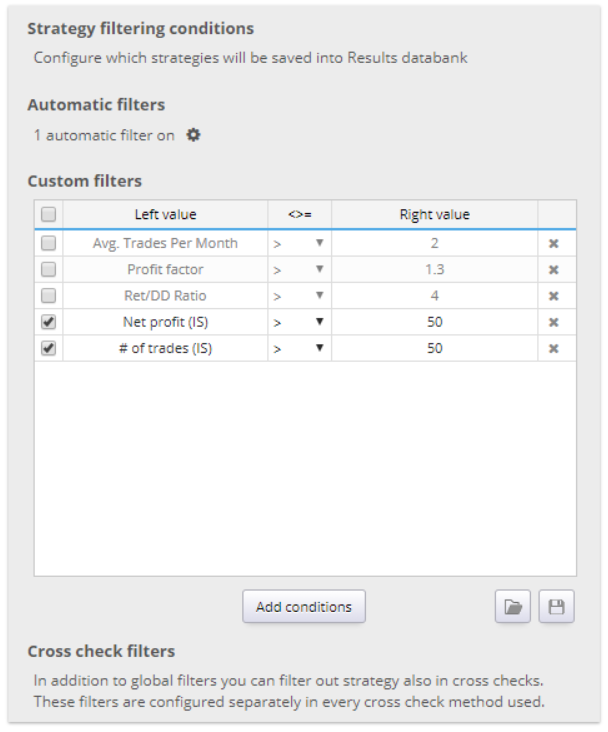
The filtering section of the menu is an option to set filters to rule out bad strategies and not save them in the databank.
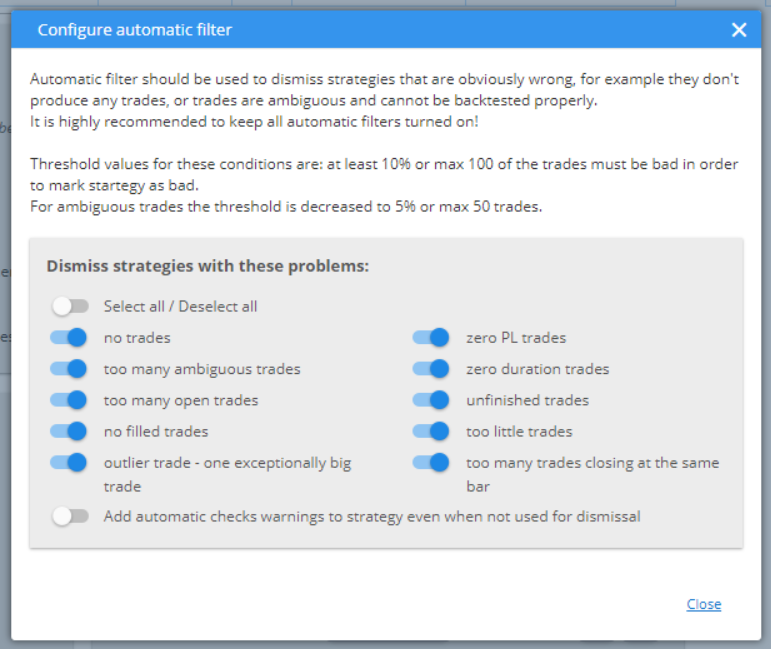
The default Automatic filters are some of the most frequently used and logical ones. They are a good way to dismiss poor strategies and save the space in the databank for fit candidates only.
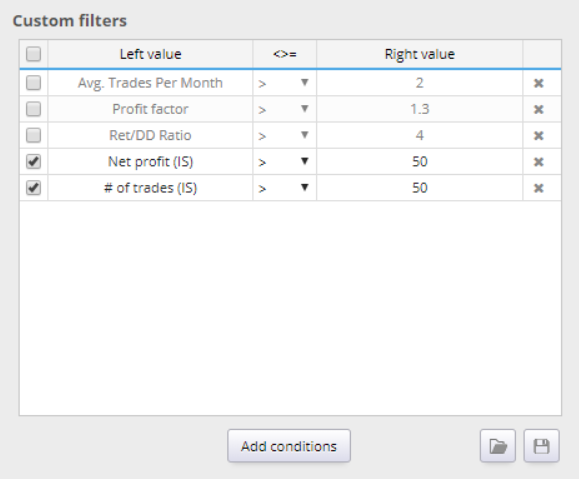
If you choose to, you can configure custom filters. You can add or remove conditions, or change their settings.
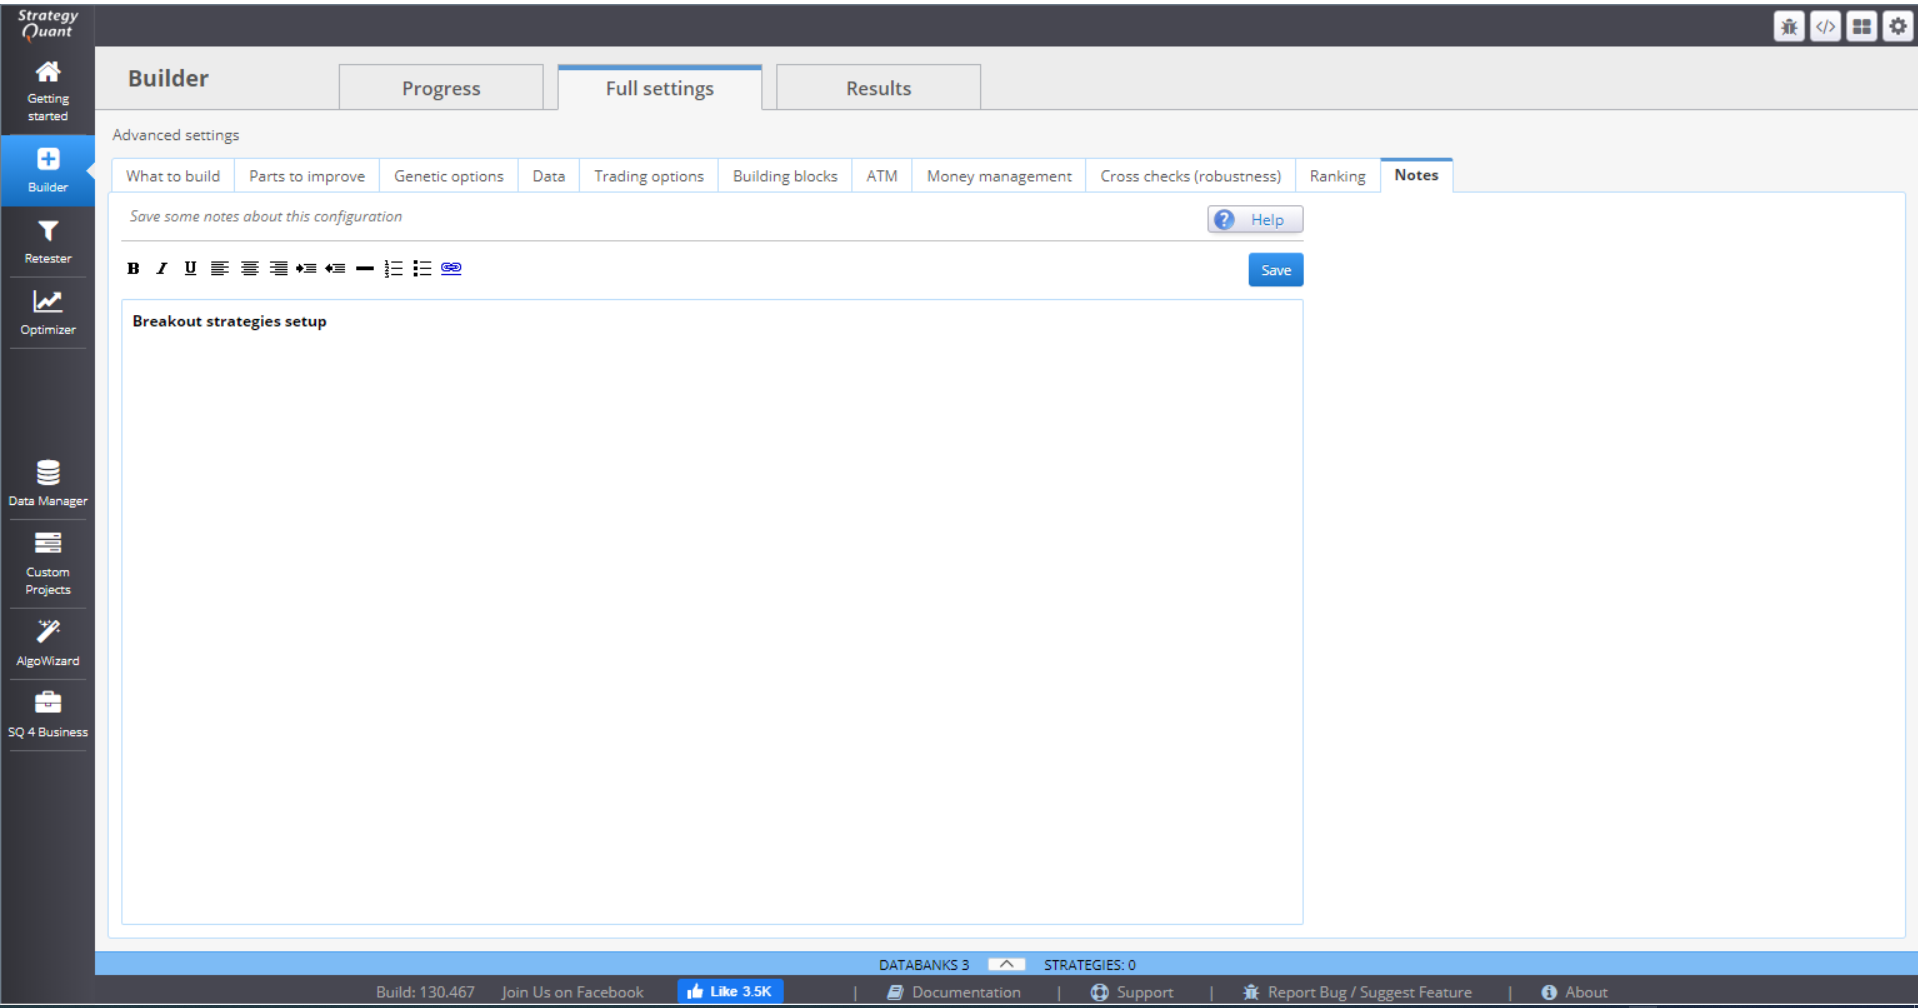
NOTES
You can write down your notes here. They will be saved together with all configuration settings of your project.
RESULTS
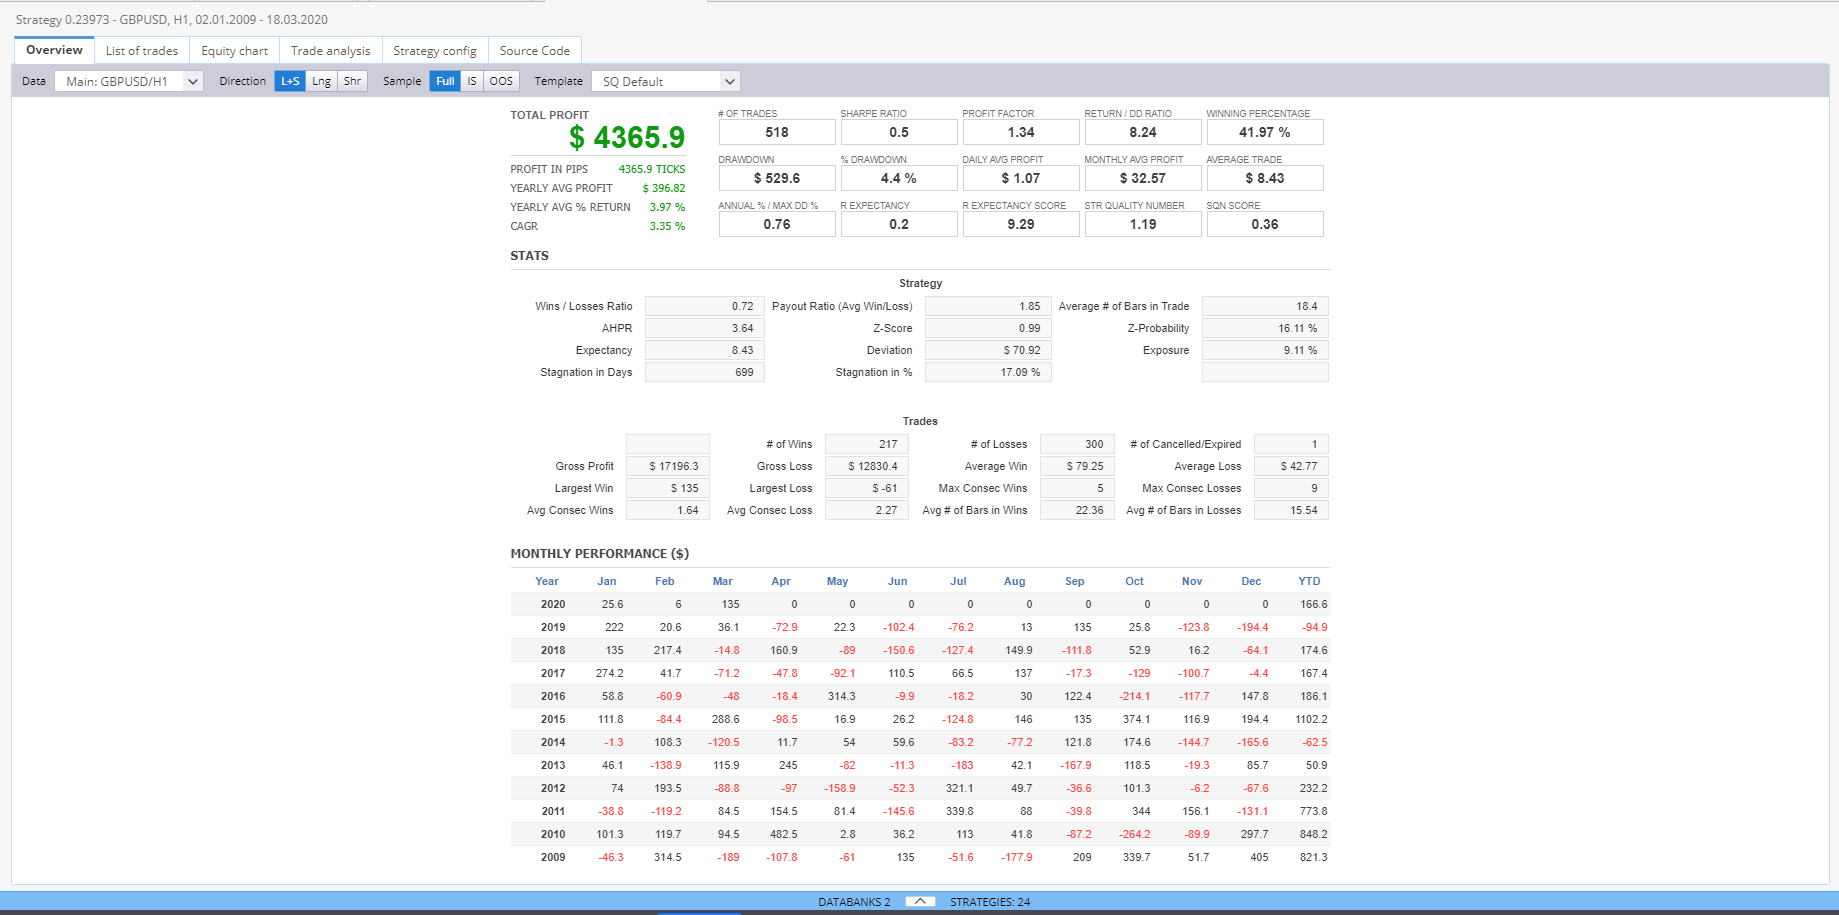
The Results tab contains a variety of charts and tables that present the details and statistics of the generated strategies.
Overview tab shows detailed statistics and the monthly performance of a strategy.
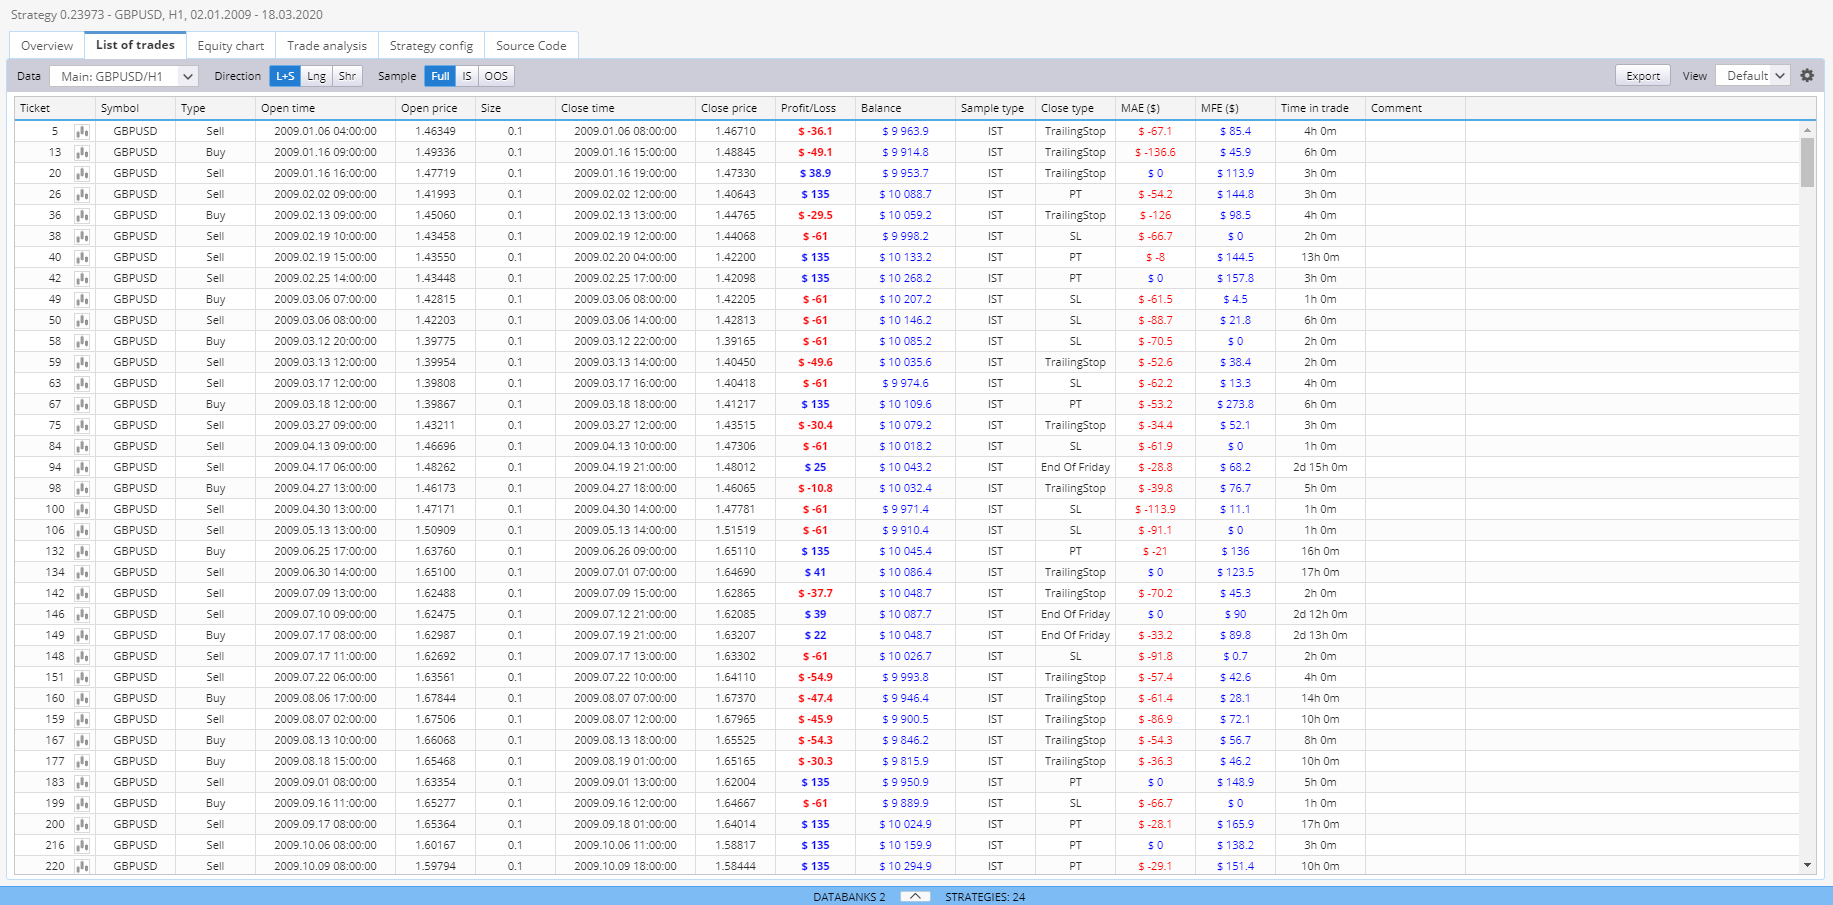
List of trades holds information of every generated strategy, recorded in the databank.
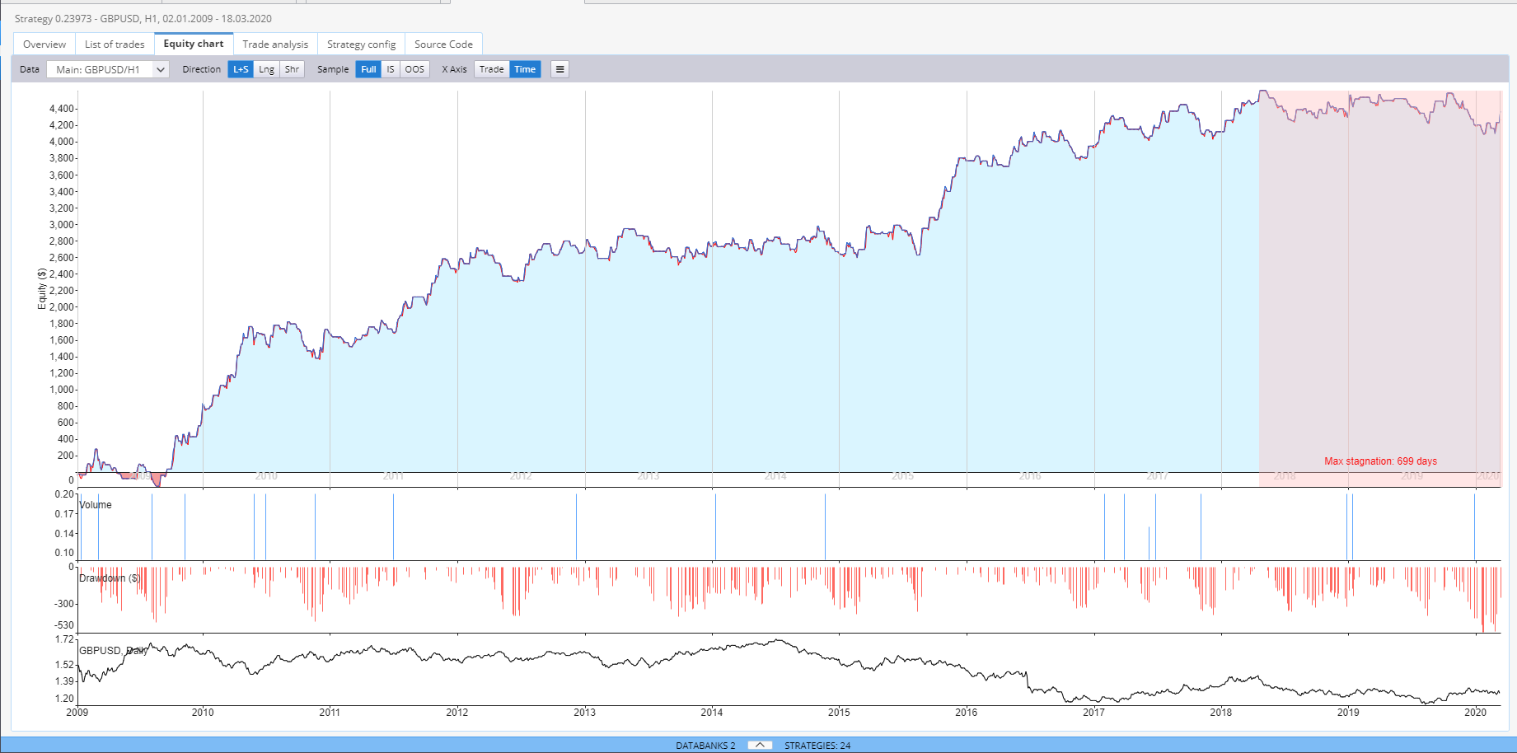
Equity chart can visualize the equity curve of a strategy.
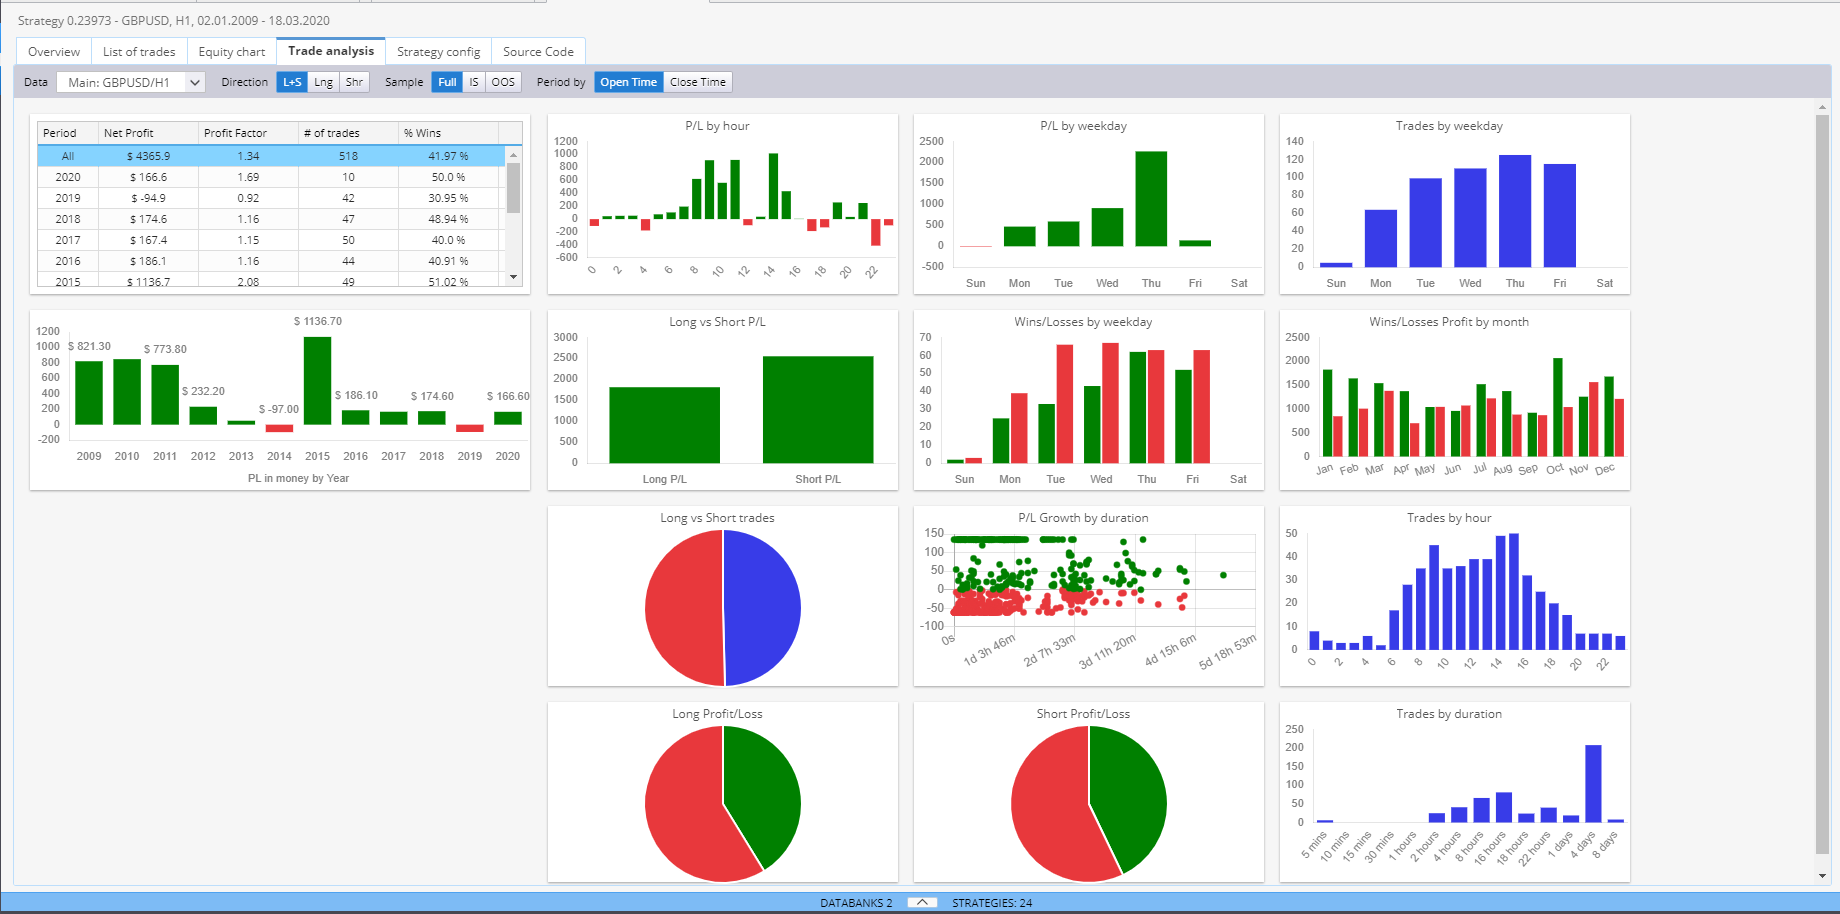
Trade analysis contains multiple charts for the performance of one strategy.
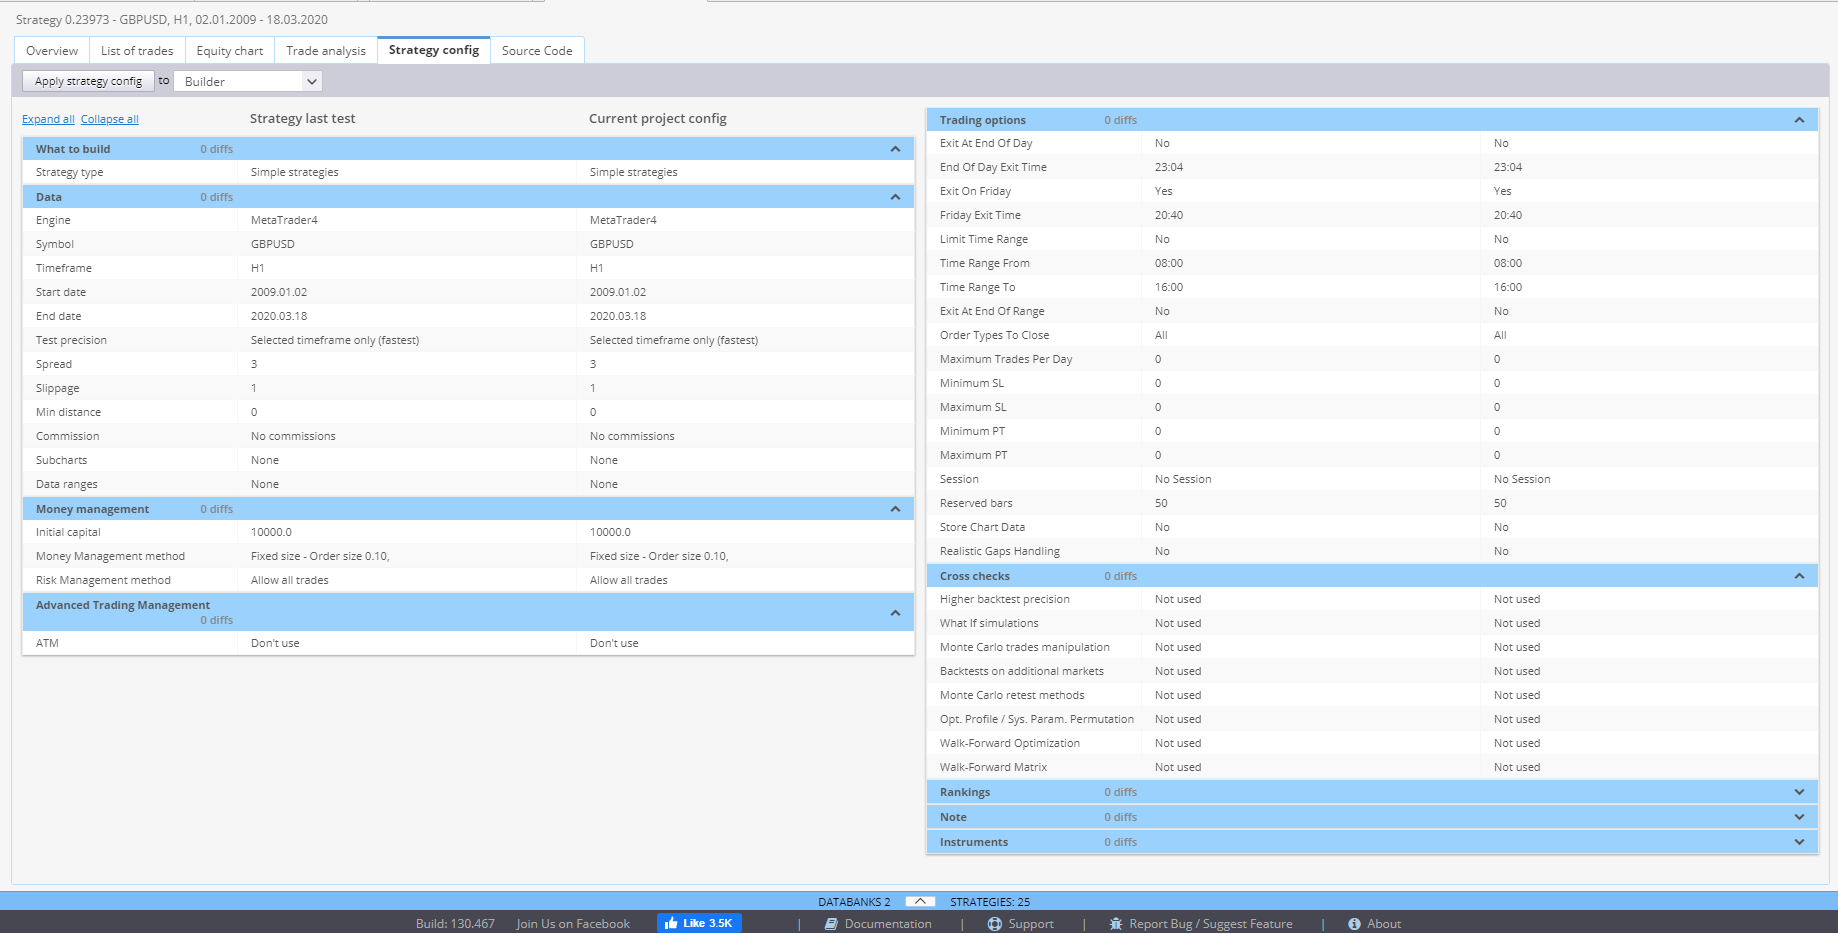
Strategy config is an overview of the current settings.
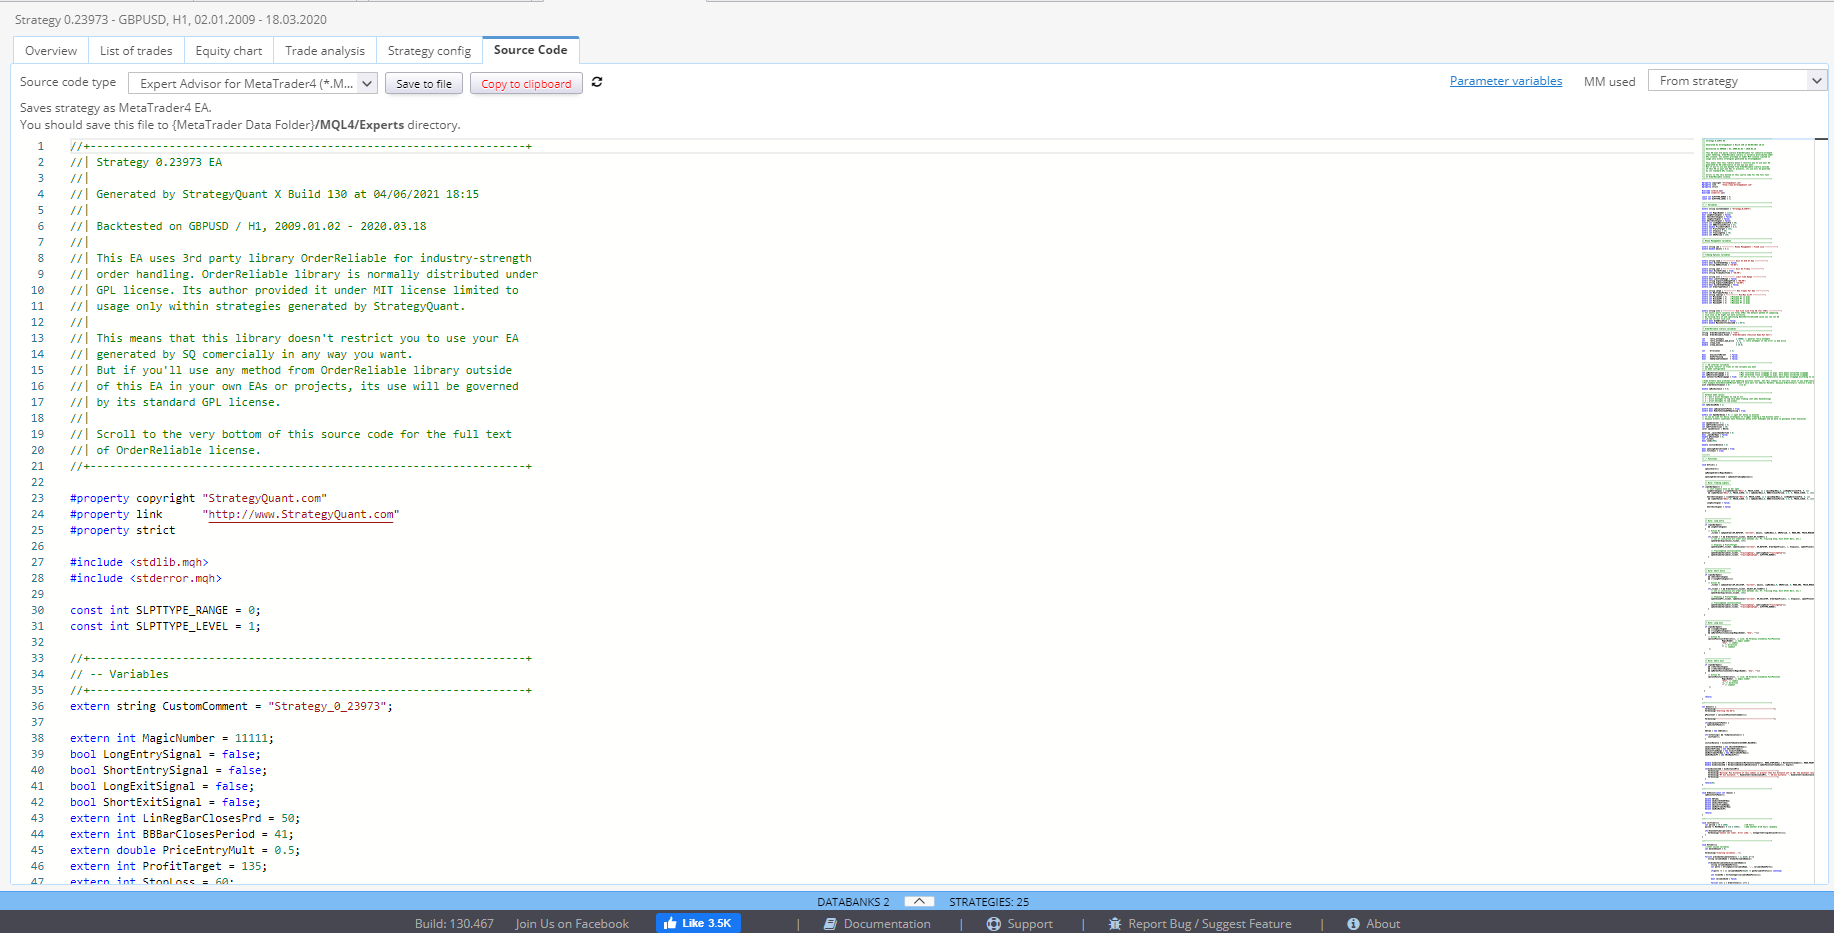
Source code is where you can get the complete code for your strategy. There are several options for how to view it. You need to select the right trading platform, so that StrategyQuant generates the proper code. You can then copy it, or save it to a file and upload it to your trading platform.
