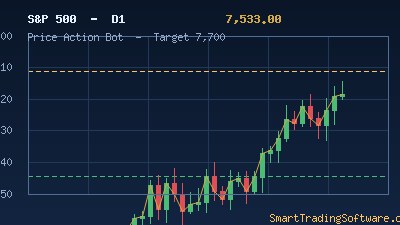
S&P 500 Slips to 7,533 After Tech Earnings Disappoint The S&P 500 is trading at 7,533 on June 4, 2026, easing 0.28% from the prior session after a sharp tech-led pullback. Broadcom collapsed nearly 14% on a Q2 revenue miss and CrowdStrike sank more than 11% on soft guidance, dragging the broader index off the ...
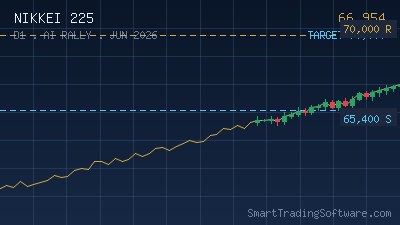
Nikkei 225 at 66,954: Trend Lines Bot for 70,000 AI Target
Nikkei 225 Smashes 66,954: AI Rally Eyes Historic 70,000 Milestone The Nikkei 225 punched out a fresh record high at 66,954 on June 1, 2026, adding 0.94% (624 points) as the AI-driven rally continued to lift Japanese equities into uncharted territory. The move was led by SoftBank (+14.99%), Murata Manufacturing (+10.18%), ...
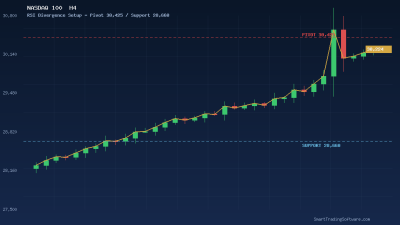
NASDAQ 100 at 30,224: RSI Divergence Bot for 28,660 Pullback
NASDAQ 100 Tests 30,000 Pivot as RSI Divergence Warns of Pullback The NASDAQ 100 closed at 30,223.89 on May 28, 2026, capping a remarkable 27% rally from the late-March lows and pressing hard against the psychological 30,000 level for the third straight session. Tech leadership has been relentless, but warning signs ...
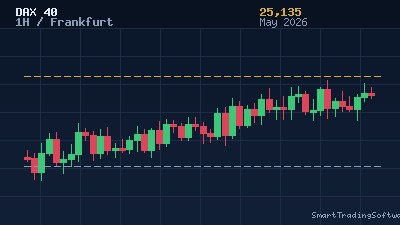
DAX 40 at 25,135: Price Action Bot Setup for 25,200 Breakout
DAX 40 Holds 25,135 as Middle East Tensions Test the German Bull Run The DAX 40 closed Thursday around 25,135 points, slipping a modest 0.2% after fresh attacks in the Strait of Hormuz between US and Iranian forces sent oil prices higher and revived inflation worries across European equity desks. Even after that wobble, ...
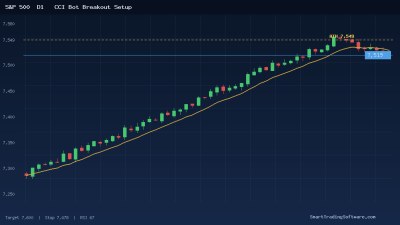
S&P 500 at 7,519: CCI Bot Setup for 7,600 ATH Breakout Push
S&P 500 Holds 7,519 Near Record High — CCI Bot Eyes a 7,600 Breakout Push The S&P 500 closed at 7,519.12 on Tuesday after a fresh intraday all-time high of 7,549.6 on May 25, extending an uptrend that has dominated price action since early April. The index is now up roughly 8.5% on the year, with Q1 ...
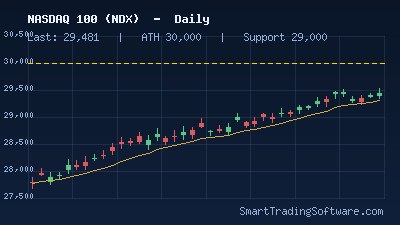
NASDAQ 100 at 29,481: Trend Lines Bot for 30,000 ATH Breakout
NASDAQ 100 Pulls Back to 29,481 After Tagging All-Time Highs Near 30,000 The NASDAQ 100 (NDX) is trading around 29,481 , just below the psychological 30,000 zone and the recent all-time high printed on May 14, 2026. After weeks of vertical extension driven by AI mega-caps and resilient earnings, the index has slowed ...
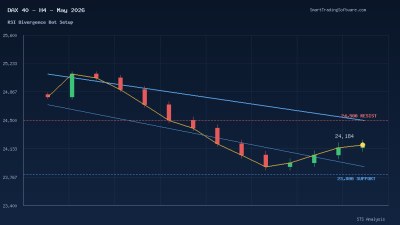
DAX 40 at 24,184: RSI Divergence Bot for 24,500 Channel Break Setup
DAX 40 Tests Channel Resistance Near 24,200 With RSI in Buy Zone The German DAX 40 has spent the past two weeks consolidating inside a descending channel after rejecting from the May 6 swing high near 25,100. Frankfurt's benchmark closed at 23,950 on May 15 following a 2.07% session decline, but buyers have since stepped ...
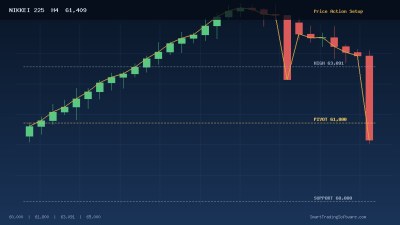
Nikkei 225 at 61,409: Price Action Bot for 61,800 Reclaim Setup
Nikkei 225 Slips Below 61,800: A Reclaim Setup Worth Watching The Nikkei 225 is trading at 61,409 after pulling back roughly 1.99% in the last session, slipping just under the 61,800 short-term pivot that bulls had been defending for most of the month. The recent local high at 63,091 was printed on May 7, and the chart ...
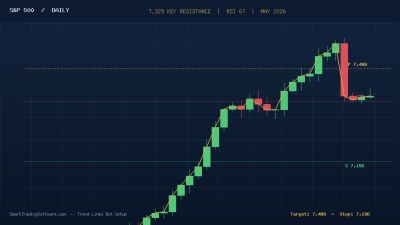
S&P 500 at 7,329: Trend Lines Bot Setup for 7,400 Breakout
S&P 500 Tests 7,329 Resistance With Bullish Momentum Intact The S&P 500 continues to grind higher in May 2026, pressing against a well-defined resistance zone near 7,329 after a sustained recovery that began in early April. Price action has been remarkably constructive: a three white soldiers candlestick pattern ...
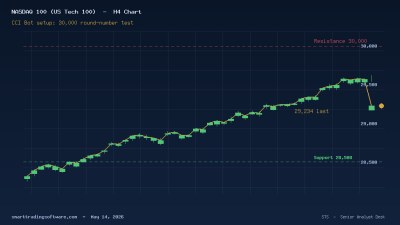
NASDAQ 100 at 29,234: CCI Bot Setup for 30,000 Psychological Test
NASDAQ 100 Pushes Toward 30,000 as Tech Rally Extends to Record Highs The NASDAQ 100 closed at 29,234 in early May 2026 and has carved out fresh all-time highs through the second week of the month, with the index trading firmly above the 29,000 level and gaining more than 2.5% over a two-session burst. Tech leadership ...
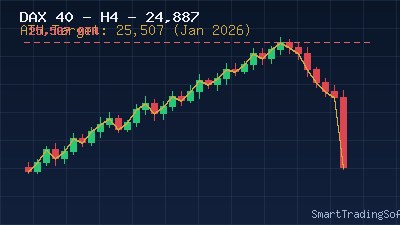
DAX 40 at 24,887: MA Distance Indicator for 25,507 ATH Retest
DAX 40 Holds Above 24,800 as Traders Eye January's 25,507 All-Time High The German DAX 40 index is trading around 24,887 points in mid-May 2026, consolidating in a tight intraday band between 24,465 and 25,116 over the past sessions. After the index printed its record high of 25,507.79 on 13 January 2026, that level ...
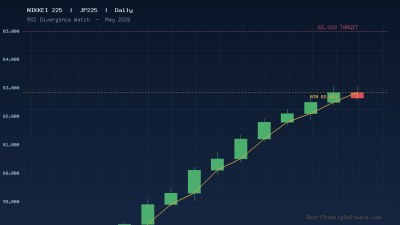
Nikkei 225 at 62,651: RSI Divergence Bot for 65,000 ATH Test
Nikkei 225 at 62,651: Record Highs Meet RSI Risk The Nikkei 225 closed Friday at 62,651 points , just below the freshly minted all-time high of 62,833.84 printed on May 7, 2026. Japan's flagship index has run nearly 25% higher year-to-date, powered by the global AI capex cycle, robust spring wage data, and an extended ...
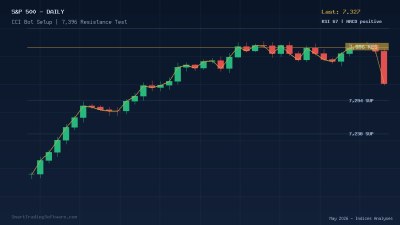
S&P 500 at 7,327: CCI Bot Setup for 7,396 Resistance Test
S&P 500 Pushes Toward 7,396 Resistance After Tagging Fresh All-Time High The S&P 500 is trading at 7,327 in early May 2026 after printing a fresh all-time high of 7,382 on May 7. The advance has been powered by a clean Three White Soldiers candlestick pattern that ran from 6,574 up through 7,143, and momentum ...
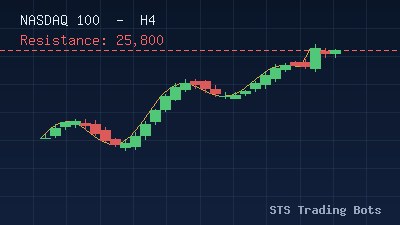
NASDAQ 100 at 25,800: RSI Divergence Bot for 24,000 Pullback
NASDAQ 100 Faces Overbought Conditions Near 25,800 Resistance The NASDAQ 100 is approaching a critical inflection point in May 2026, trading near 25,800 after a sustained rally driven by continued AI-related capital flows and easing rate expectations. The index has been carving out a symmetrical triangle pattern with ...
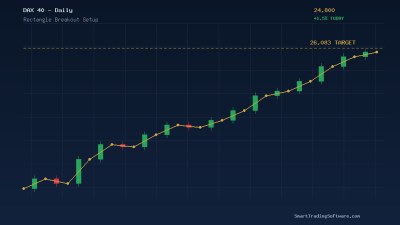
DAX 40 at 24,800: Trend Lines Bot Setup for 26,083 Breakout
DAX 40 Pushes to 24,800: Range Breakout Setup Targets 26,083 Frankfurt's DAX 40 climbed more than 1.5% on May 6, 2026, lifting the German benchmark to roughly 24,800 — the highest level since late February. The move was sparked by renewed optimism around a potential US-Iran framework, easing geopolitical risk premia a ...
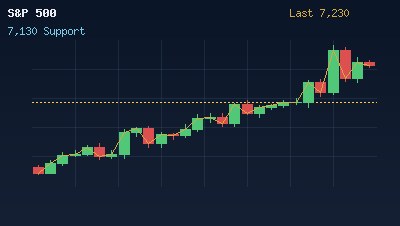
S&P 500 at 7,230: Price Action Bot Setup for 7,130 Pullback
S&P 500 Near Record Highs: Watching the 7,230 Zone in Early May 2026 The S&P 500 has carried its bullish momentum into May, printing a fresh all-time high of 7,272.52 on May 1, 2026 before settling around the 7,230 area. The benchmark gained roughly 1.6% on that session as cooling oil prices and renewed strength in mega-cap ...
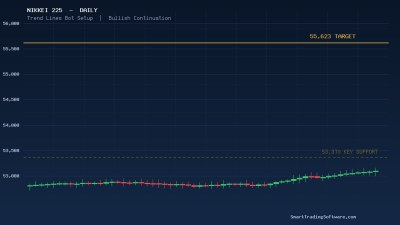
Nikkei 225 at 53,370: Trend Lines Bot Setup for 55,623 Target
Nikkei 225 Holds Key Support at 53,370 as Japanese Equities Lead Global Rally The Nikkei 225 has emerged as one of 2026's most compelling equity stories, climbing roughly 7.9% year-to-date and outpacing the major US benchmarks despite ongoing concerns over rising Japanese Government Bond yields. As of early May 2026, ...
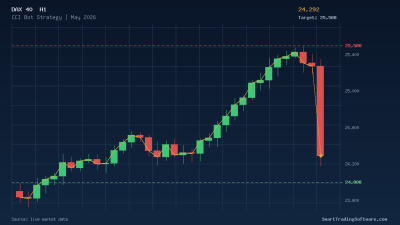
DAX 40 at 24,292: CCI Bot Strategy for 25,500 Resistance Test
DAX 40 Trades Near 24,292 as Bulls Eye the 25,500 January High Germany's flagship index has been carving out a constructive base around the 24,000 psychological level, with the DAX 40 currently changing hands near 24,292 after a strong 1.4% session that lifted the benchmark off recent lows. Heavyweights such as Deutsche ...
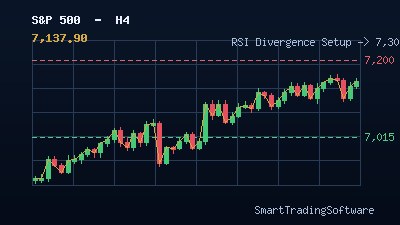
S&P 500 at 7,138: RSI Divergence Bot Setup for 7,300 Resistance
S&P 500 Holds 7,138 as Bulls Eye the 7,200–7,300 Resistance Band The S&P 500 index closed at 7,137.90 on April 29, 2026, bouncing 1.05% (+73.89 points) and consolidating just below its all-time intraday high of 7,168.59 printed on April 24. After a tense Q1 that saw the index whip between 6,500 and 6,700, ...
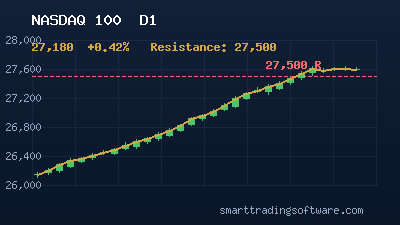
NASDAQ 100 at 27,180: CCI Bot Strategy for 27,500 Reversal
NASDAQ 100 Approaches 27,500 Resistance After Historic Rally The NASDAQ 100 has powered into the second half of April 2026 trading near 27,180 , just a stone's throw from the well-watched 27,500 resistance band . After clearing the 26,672 pivot earlier this month, the index has stretched its winning streak into double ...